Created
:2023.11.13

Myforex's volatility analysis tool allows you to analyze the price movement for a given instrument and time period. Specify a symbol and period to view the volatility by day, hour, and day of the week as a chart and data table.
Related article: What is the volatility analysis on Myforex?
Here we will show you how to use a volatility analysis tool.
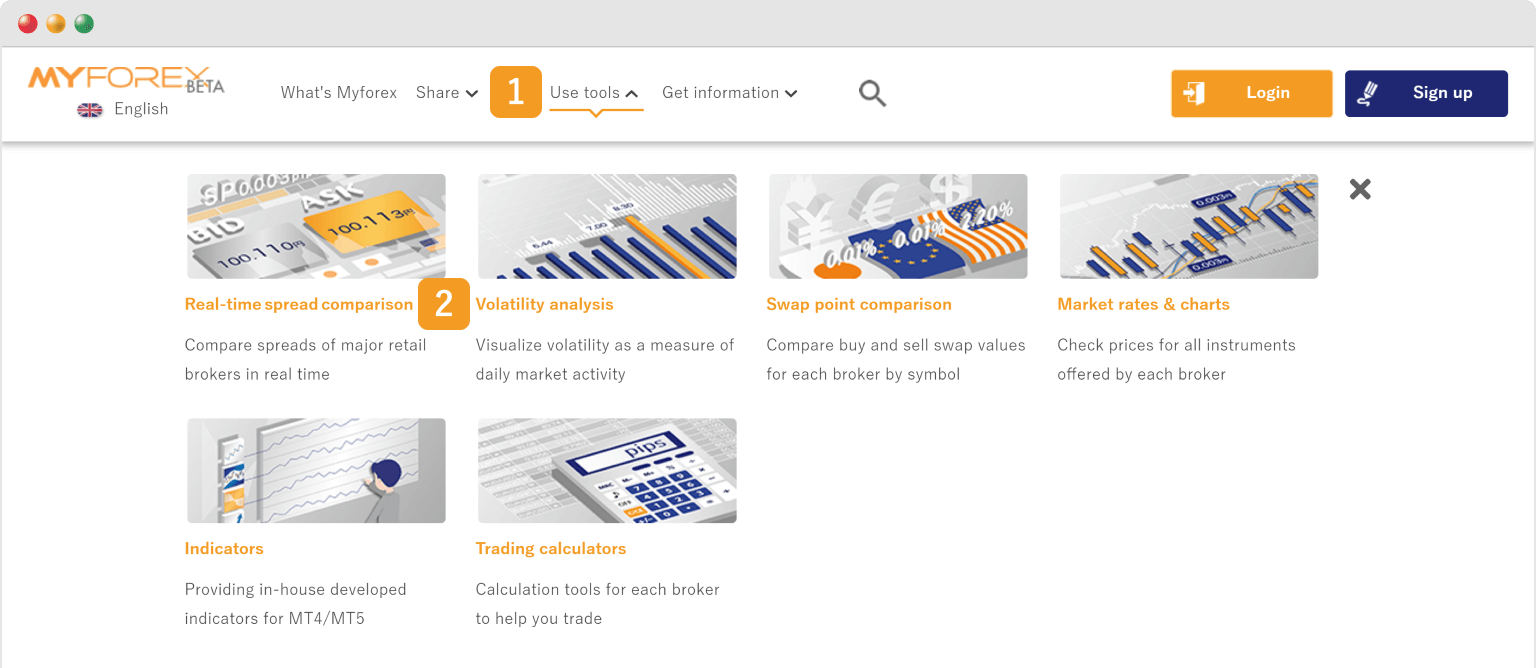
Click (1) "Use tools" shown at the top of Myforex website > (2) "Volatility analysis".
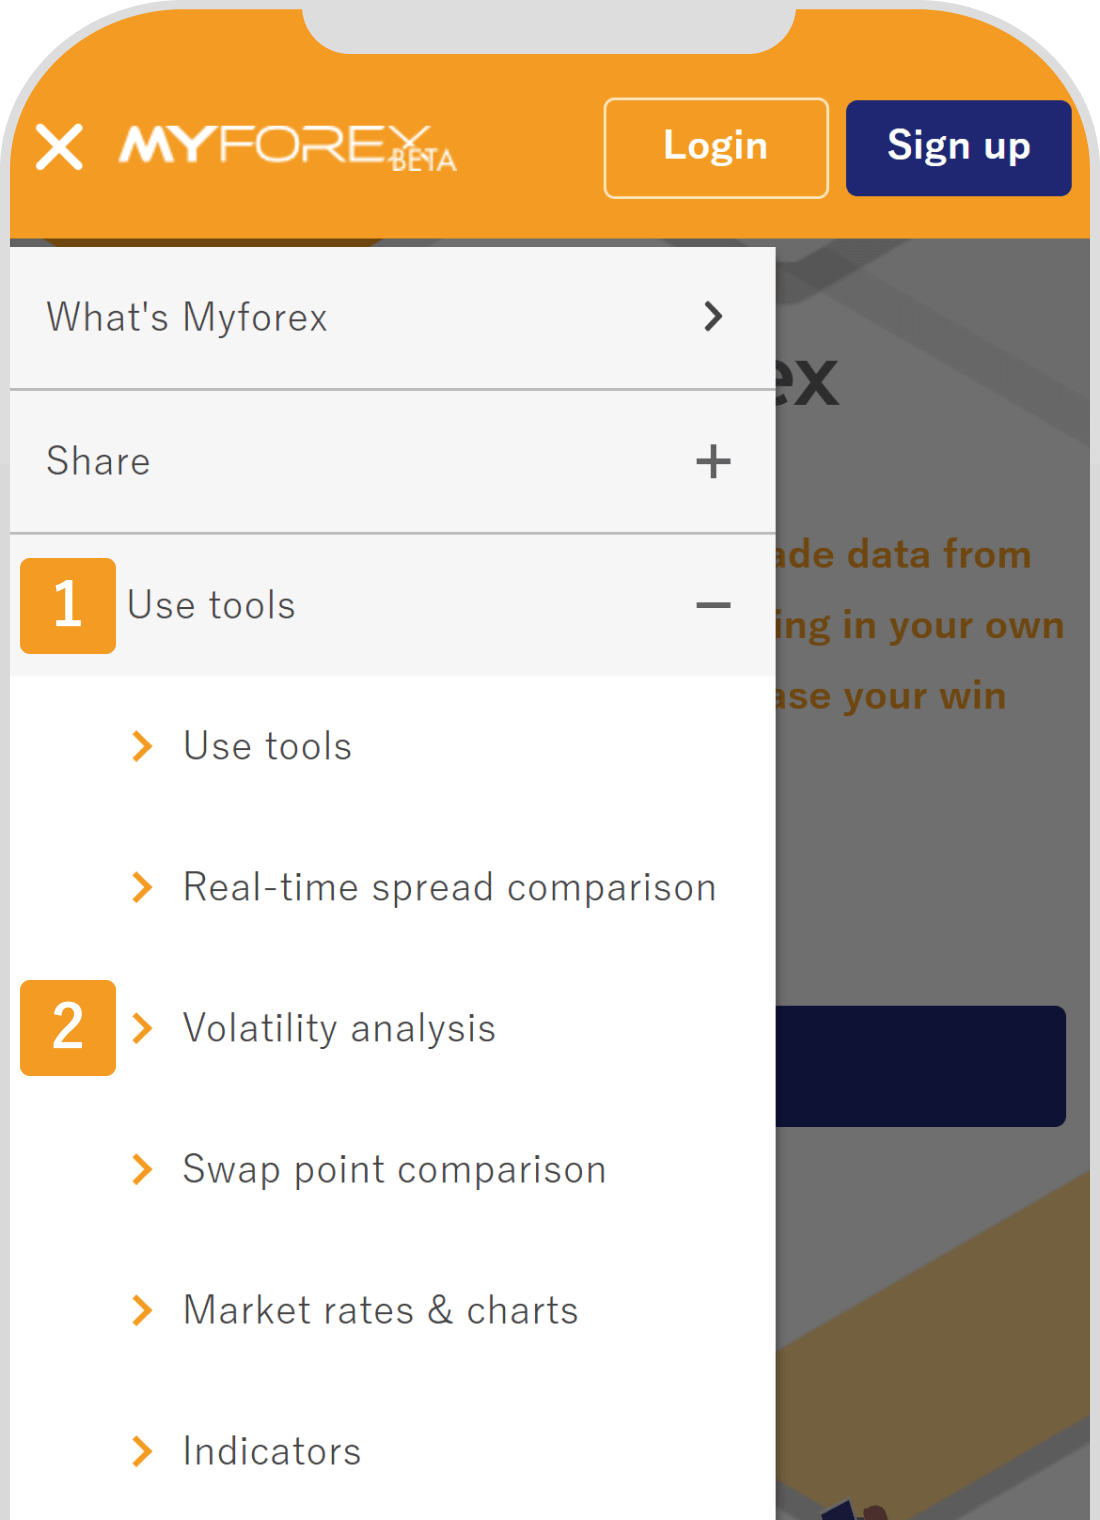
Tap (1) "Use tools" from three lines at the top left of Myforex website > (2) "Volatility analysis".
Volatility is the rate or range of fluctuation. In forex trading, the higher the volatility, the more opportunities there are to take advantage of price fluctuations and make a profit.
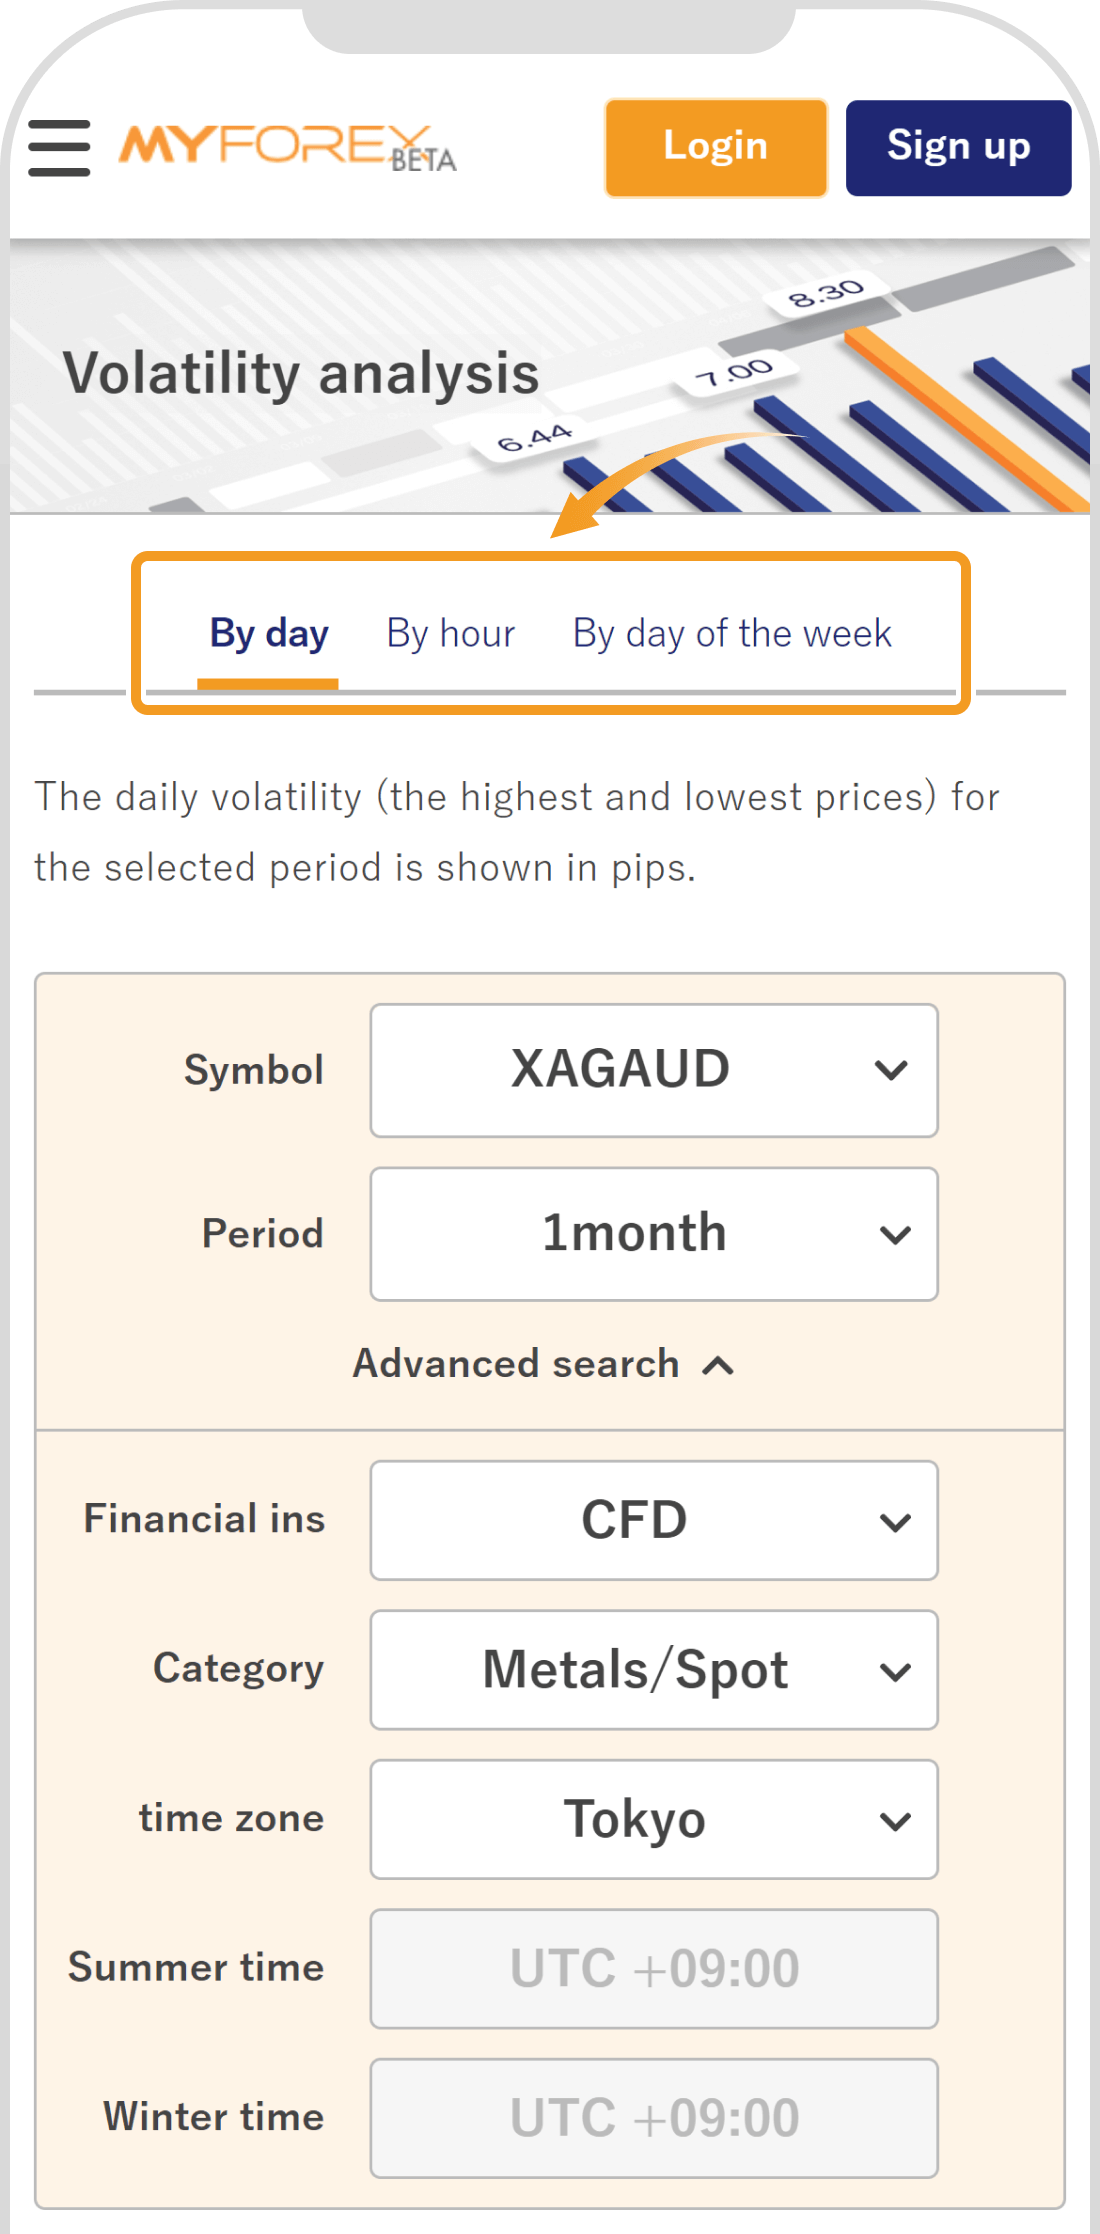
You can show the volatility by day, hour, or day of the week. Choose one of the tabs.
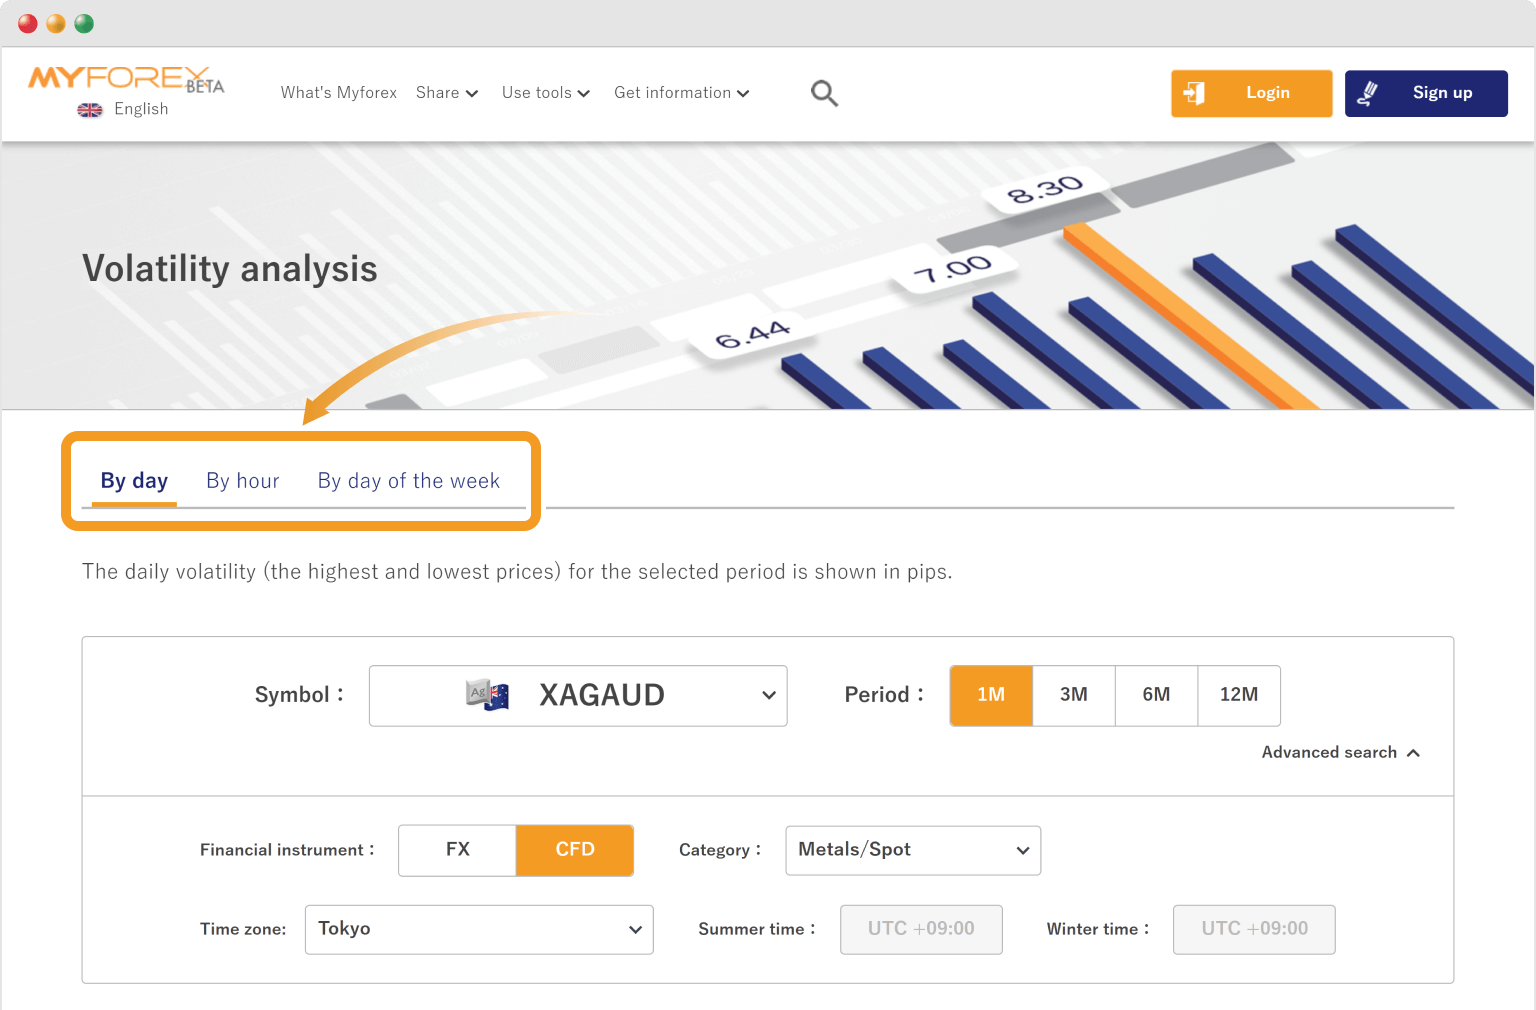
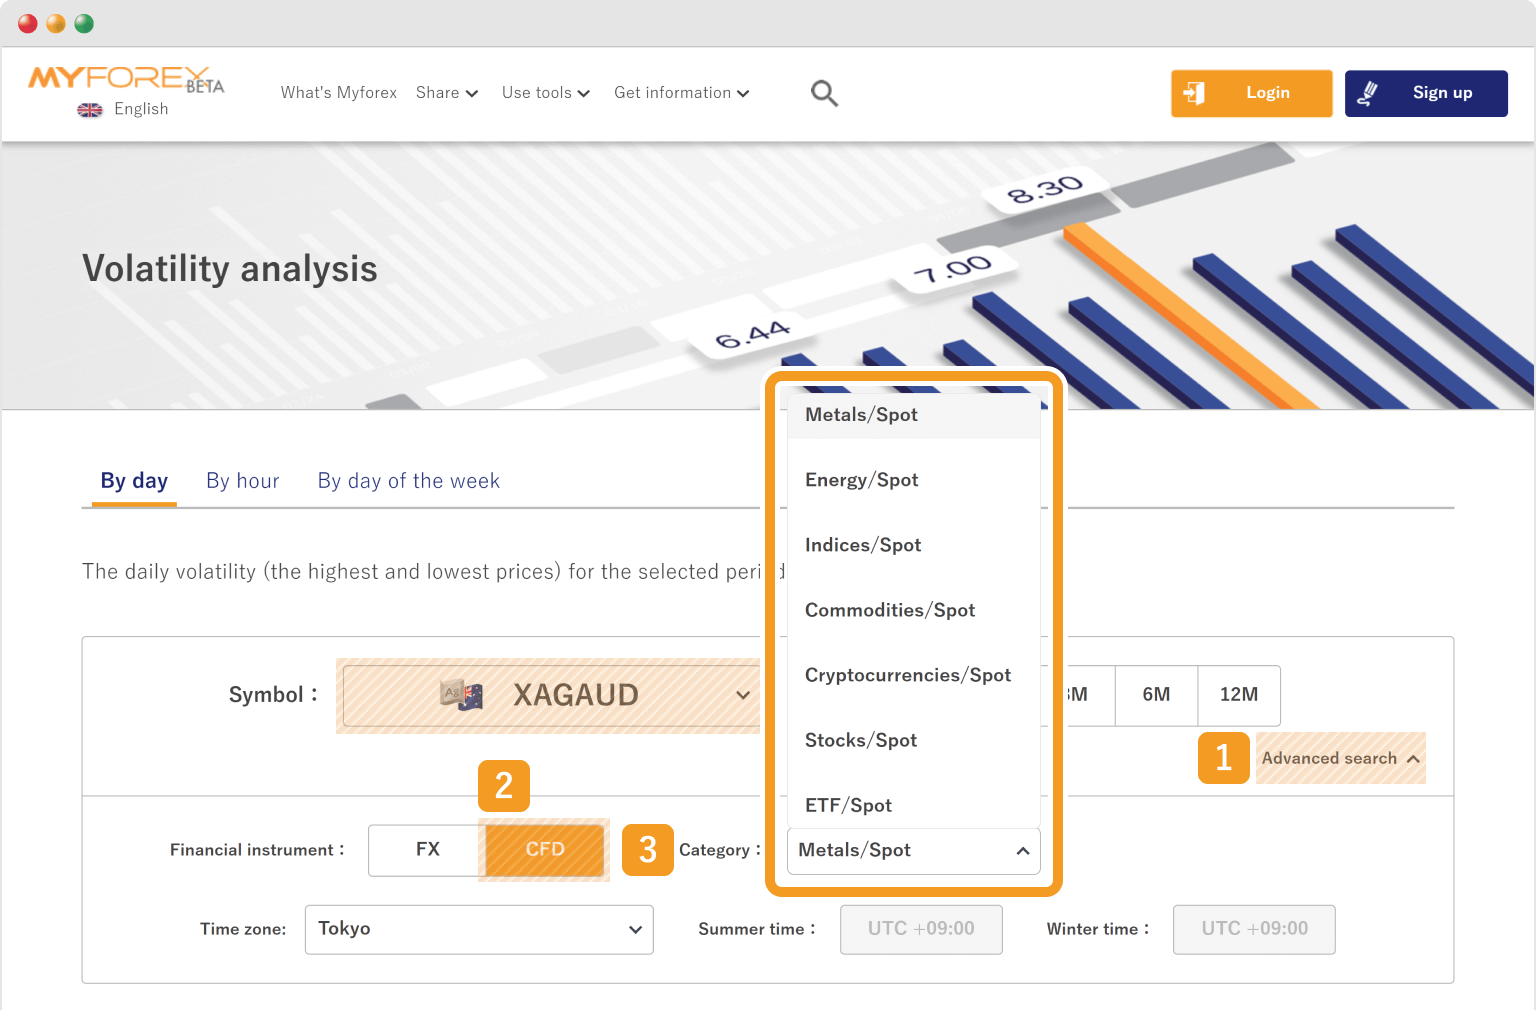
Next, choose your preferred symbol. For CFDs, click (1) Advanced search and (2) CFD as a financial instrument. Choose a (3) category to show its list of products in the Symbol section.
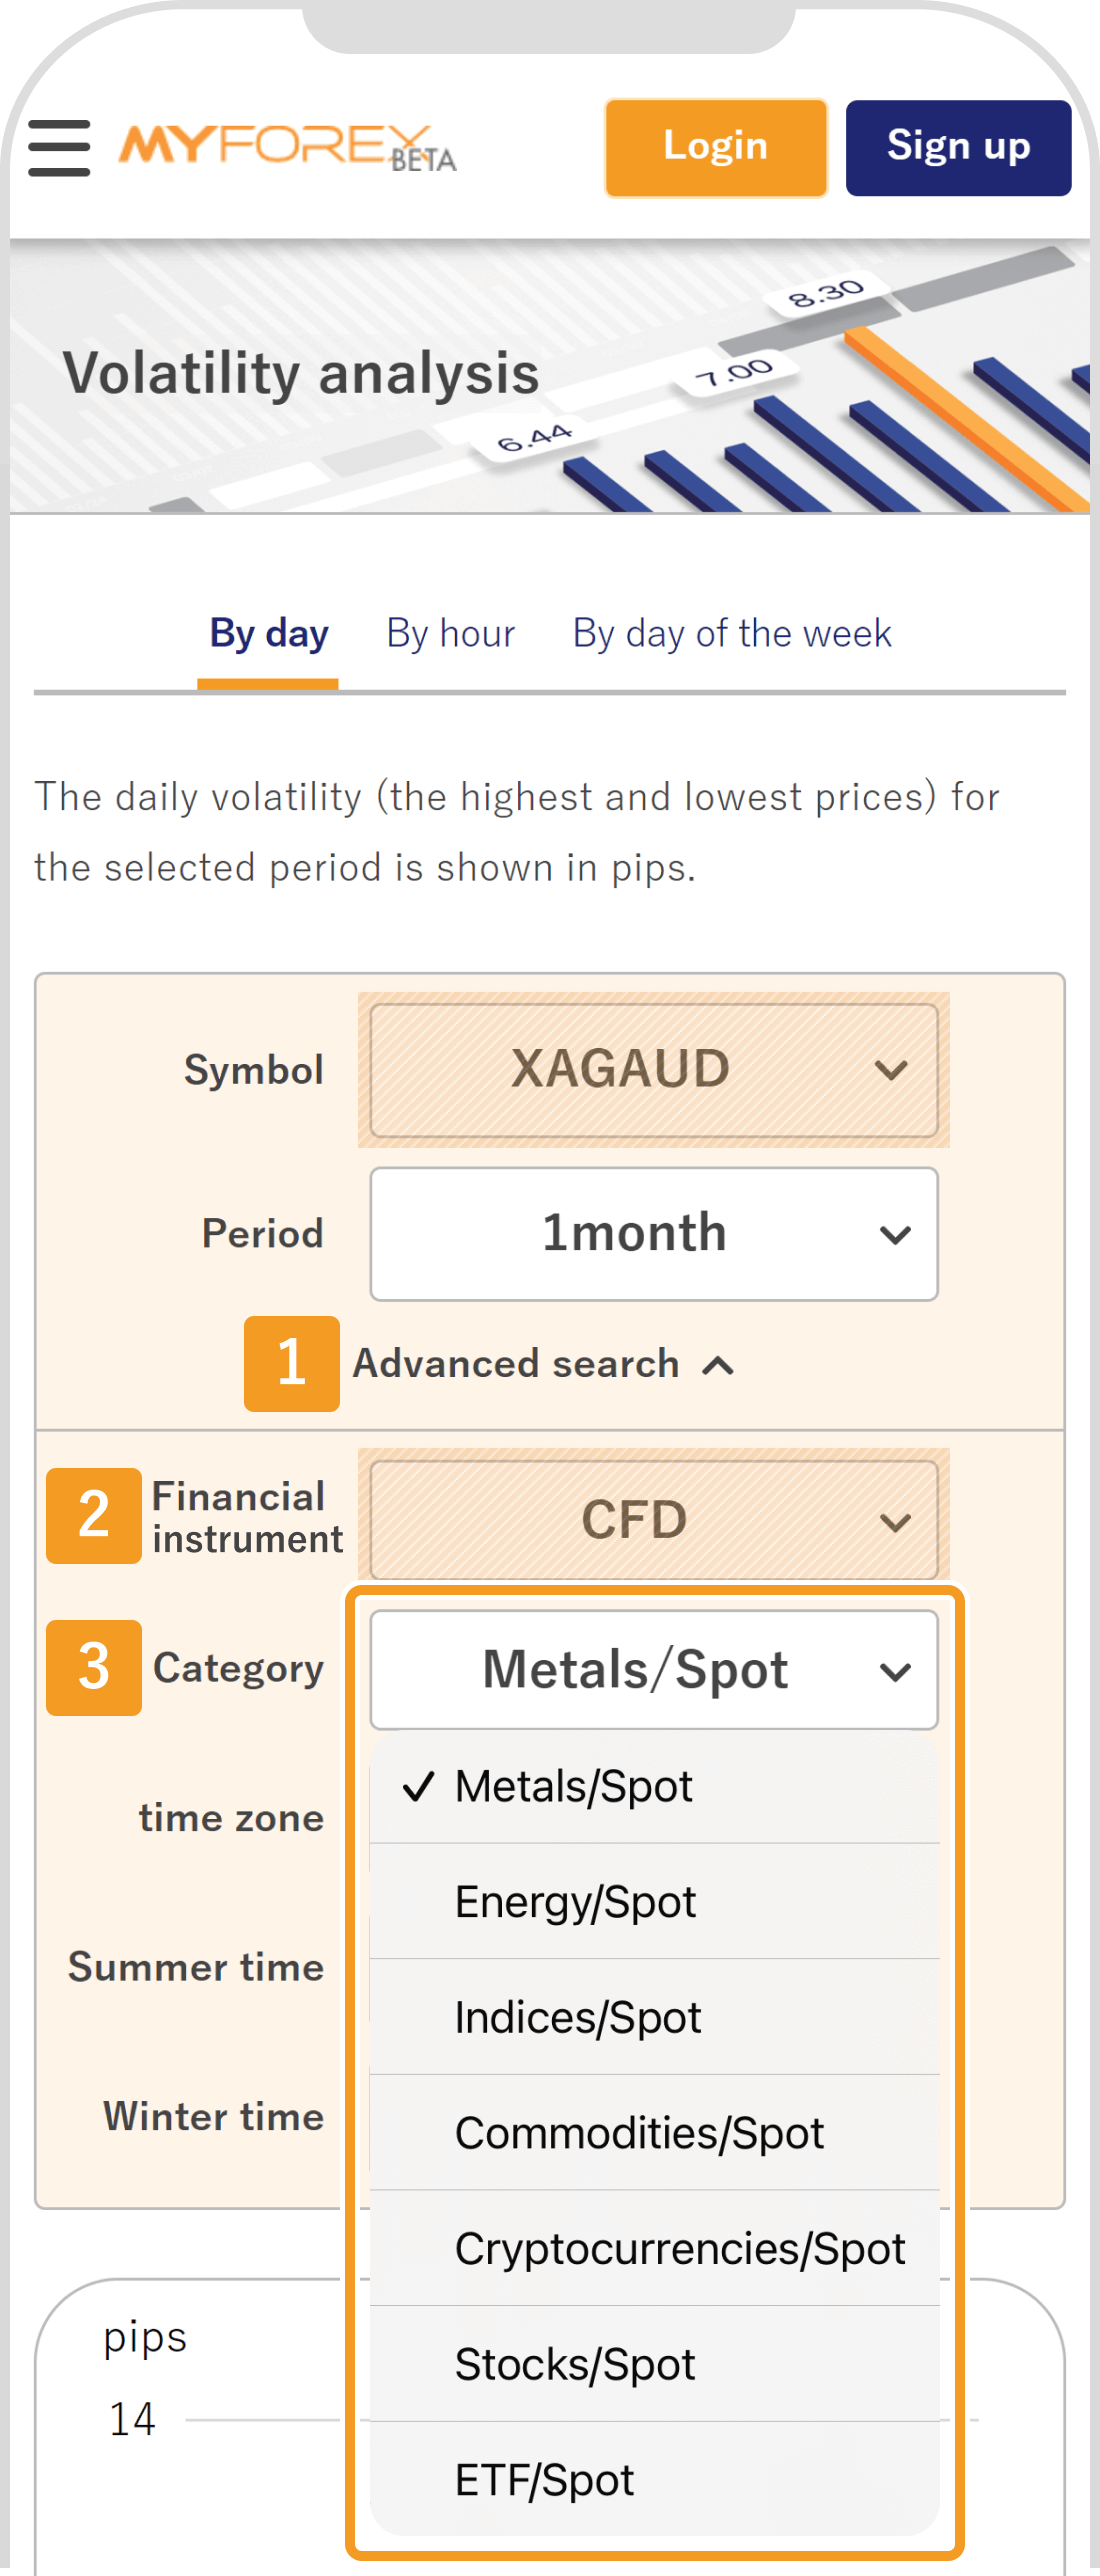
Next, choose your preferred symbol. For CFDs, tap (1) Advanced search and (2) CFD as a financial instrument. Choose a (3) category to show its list of products in the Symbol section.
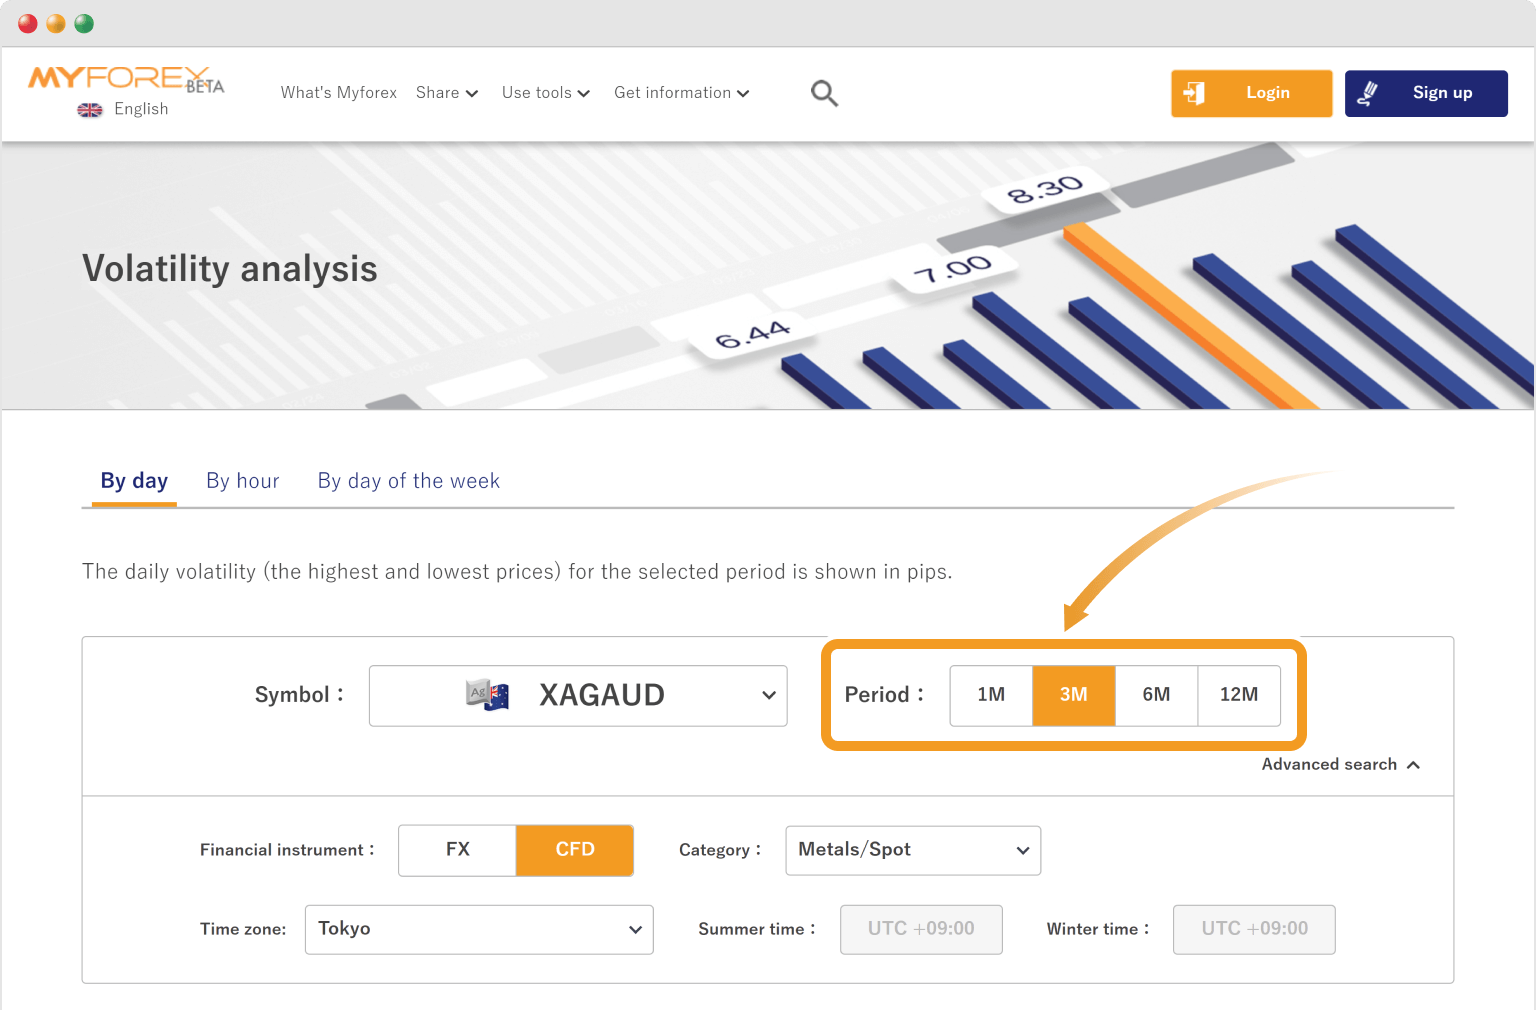
Select the period to analyze in the Period section. For example, choosing "3M" in the By day tab shows the volatility for the last 3 months.
On the By hour or By day of the week tabs, options have a W that stands for week (e.g., 1W means the last 1 week).
Select the period to analyze. For example, choosing "3months" in the By day tab shows the volatility for the last 3 months.
On the By hour or By day of the week tabs, options have a W that stands for week (e.g., 1W means the last 1 week).

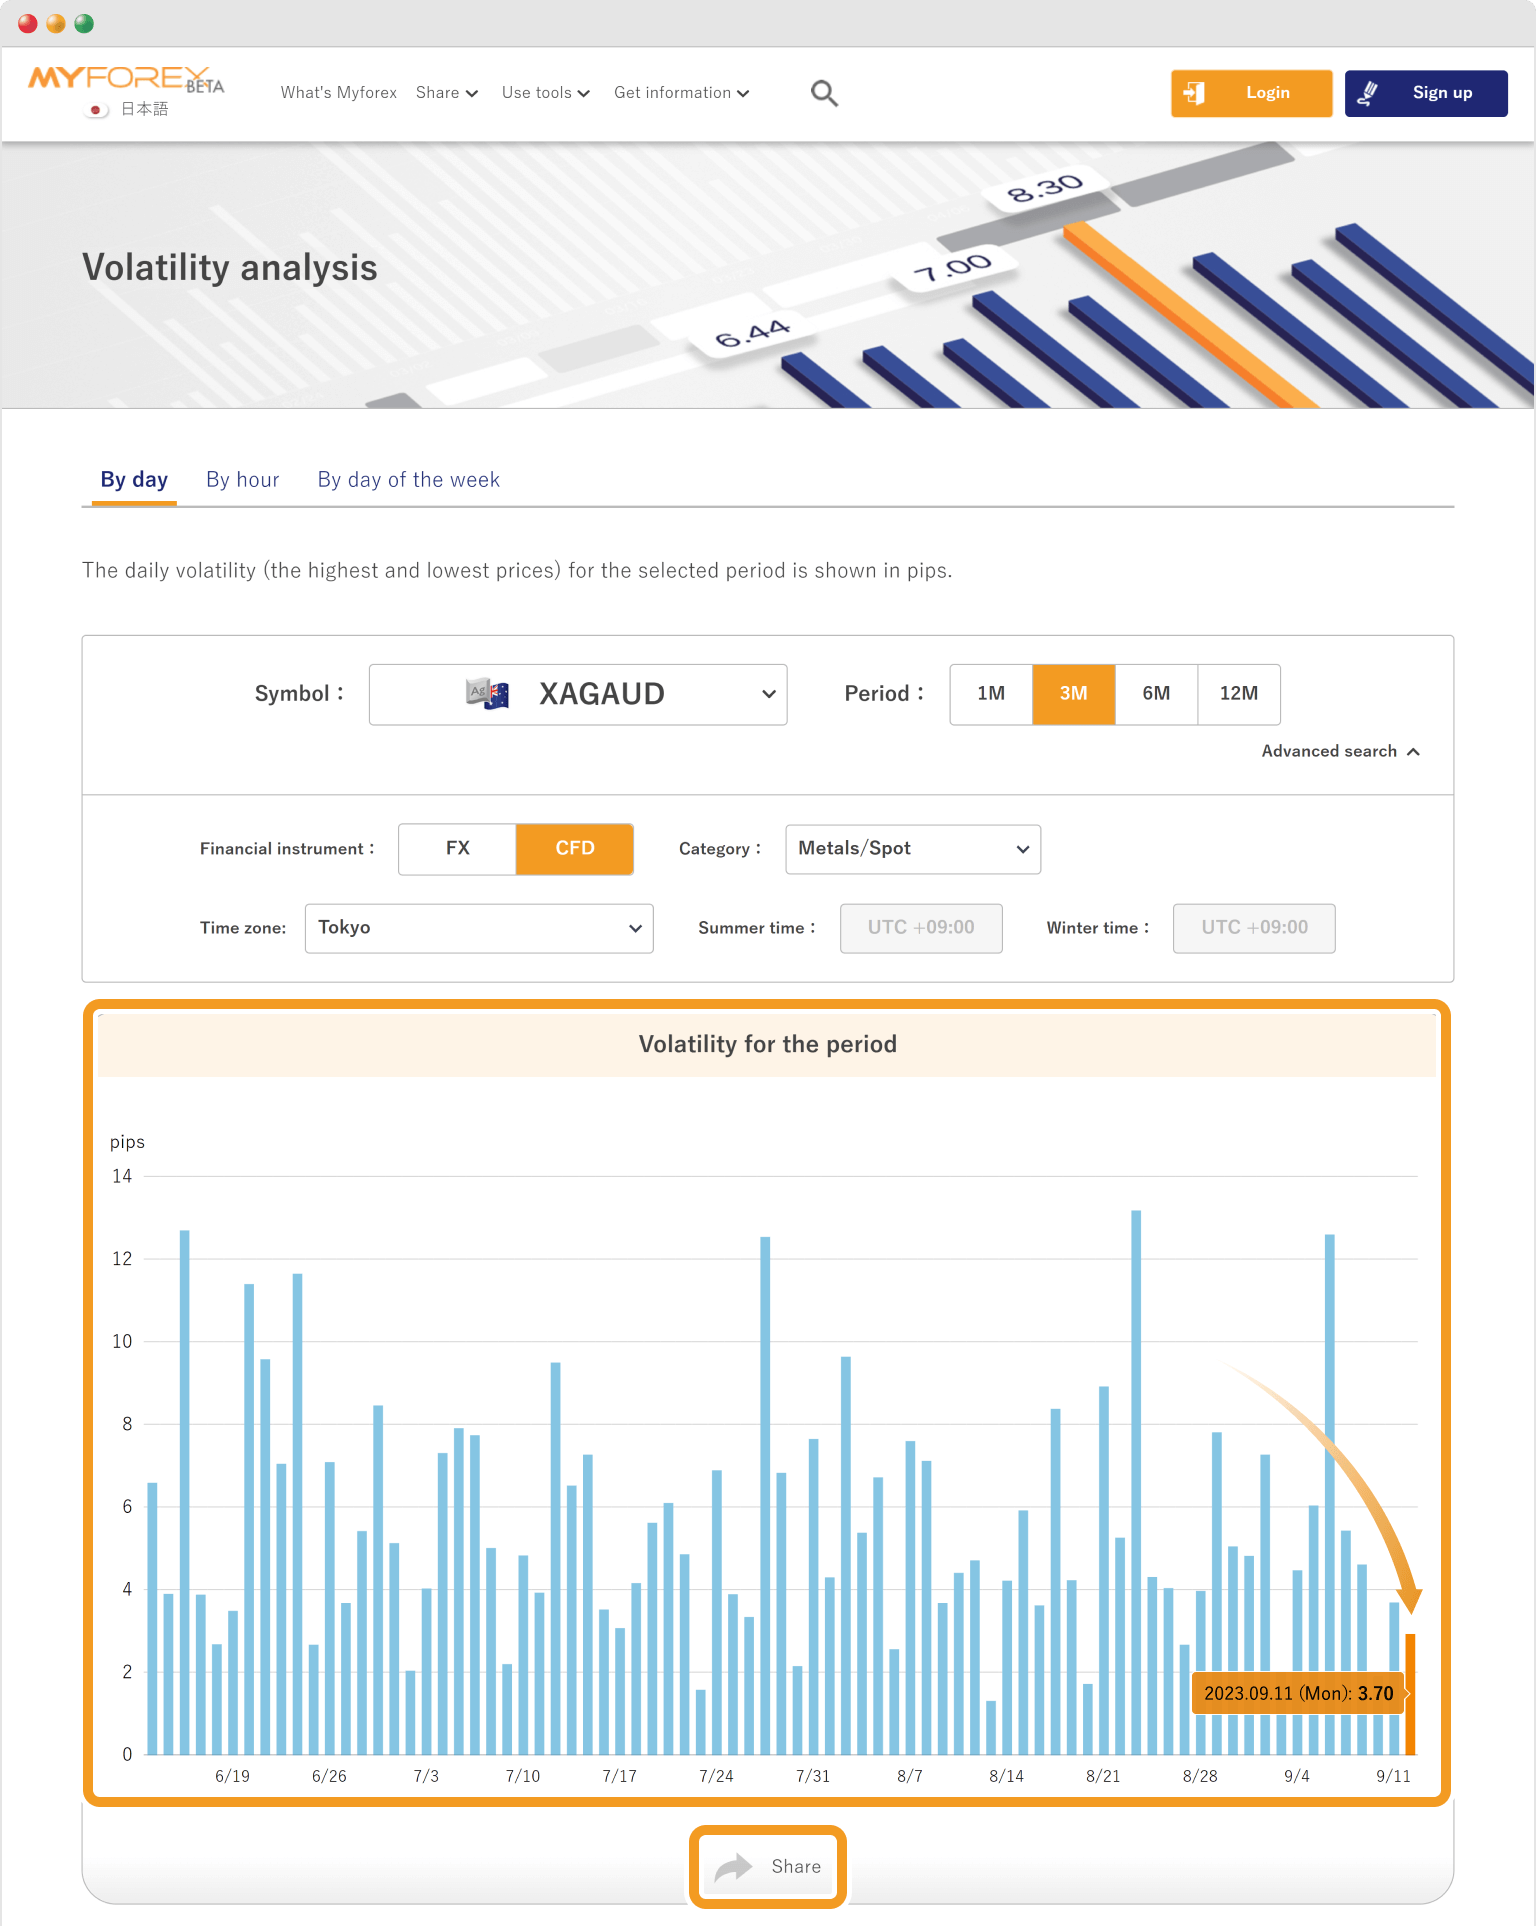
The chart shows the fluctuation range (pips) for the selected time period, allowing you to compare the most volatile times. Real-time fluctuations are indicated by orange bars. When you move the cursor over any bar graph, the date and volatility for that day are displayed in a small window.
You can click "Share" below the chart to post it on X (Twitter) or Facebook, or get the embed code. The embed code is available only after logging in to Myforex.
Please refer to the following article for information on how to log in.
The chart shows the fluctuation range (pips) for the selected time period, allowing you to compare the most volatile times. Real-time fluctuations are indicated by orange bars. When you move the cursor over any bar graph, the date and volatility for that day are displayed in a small window.
To share the chart with others, tap "Share" below. X (Twitter) and Facebook are available for sharing.
Please refer to the following article for information on how to log in.
Related article: How do I log into the Myforex Client Manager?

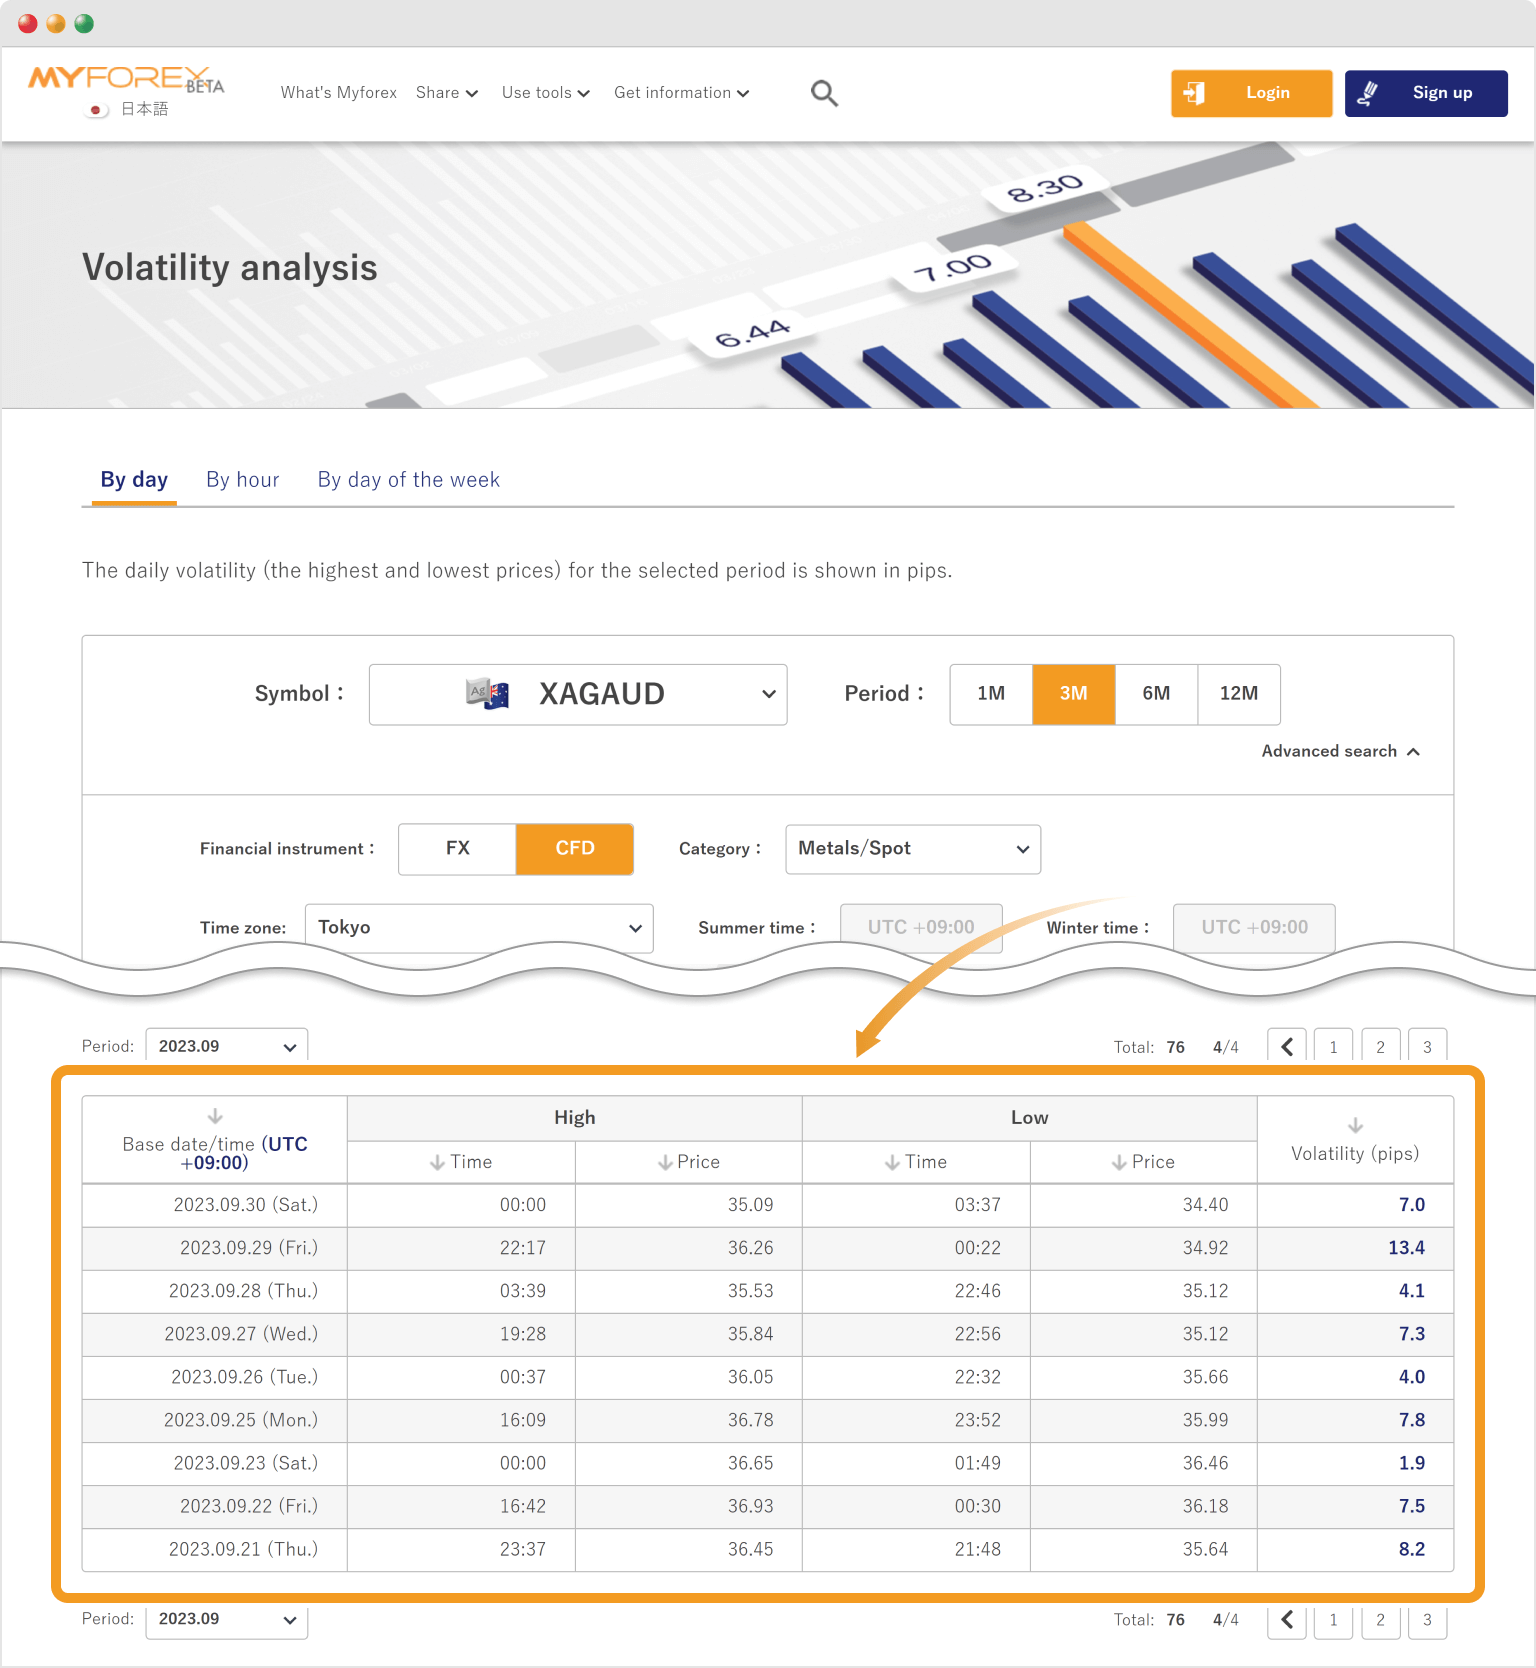
Below the chart, there is a data table that contains: the time and value of the highest and lowest prices and the volatility (high - low). This data can be sorted by price, volatility, etc.

![]()
Created
:2023.11.13
![]()
Last updated
:2024.11.22
Was this article helpful?
That’s Great!
Thank you for your feedback
Sorry! We couldn't be helpful
Thank you for your feedback
Feedback sent
We appreciate your effort and will try to fix the article
We hope you find this article useful. Any comments or suggestions will be greatly appreciated.
We are also looking for writers with extensive experience in forex and crypto to join us.
Please contact us at support@myforex.com

Disclaimer:
All information and content provided on this website is provided for informational purposes only and is not intended to solicit any investment. Although all efforts are made in order to ensure that the information is correct, no guarantee is provided for the accuracy of any content on this website. Any decision made shall be the responsibility of the investor and Myforex does not take any responsibility whatsoever regarding the use of any information provided herein.
The content provided on this website belongs to Myforex and, where stated, the relevant licensors. All rights are reserved by Myforex and the relevant licensors, and no content of this website, whether in full or in part, shall be copied or displayed elsewhere without the explicit written permission of the relevant copyright holder. If you wish to use any part of the content provided on this website, please ensure that you contact Myforex.