

Created
:2026.07.14

This section aggregates your account's margin status and past trading history to visualize helpful statistical data. You can check "Account details," "Trading days and P/L," "Overall performance graph," and "Statistics," with the ability to toggle displays based on your preferences.
The specific items you can check on the Performance screen are as follows:
In the Account details section, you can check your current account balance and margin status.
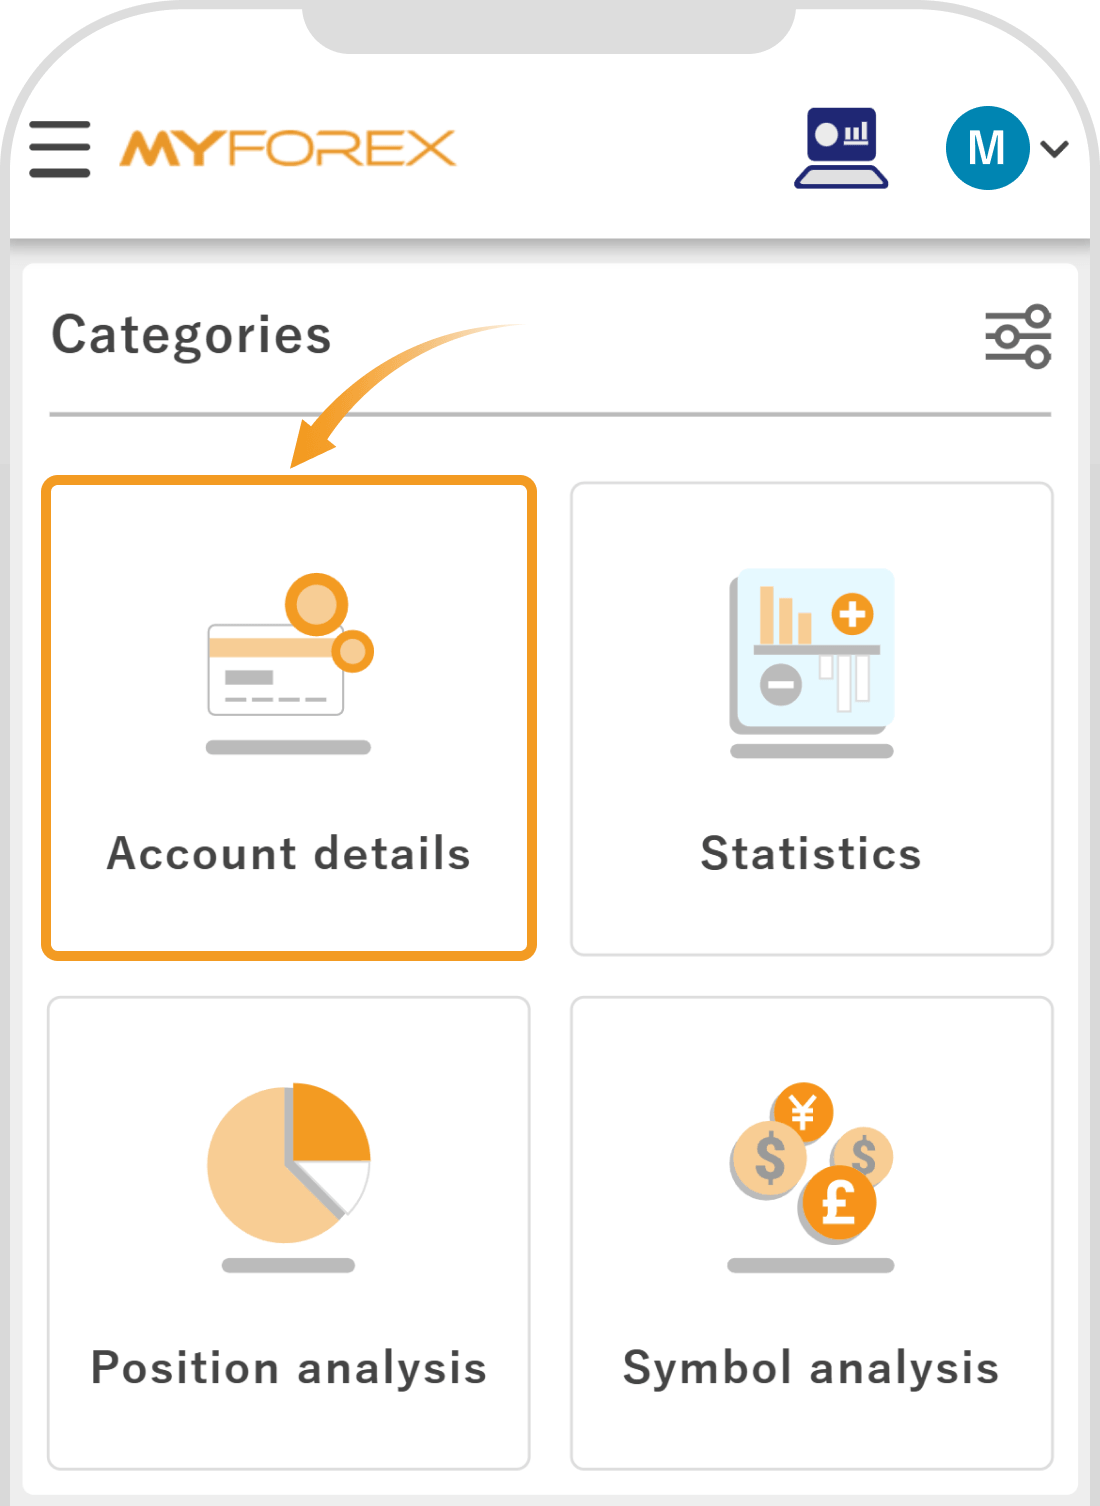
Please tap "Account details" in the Categories.
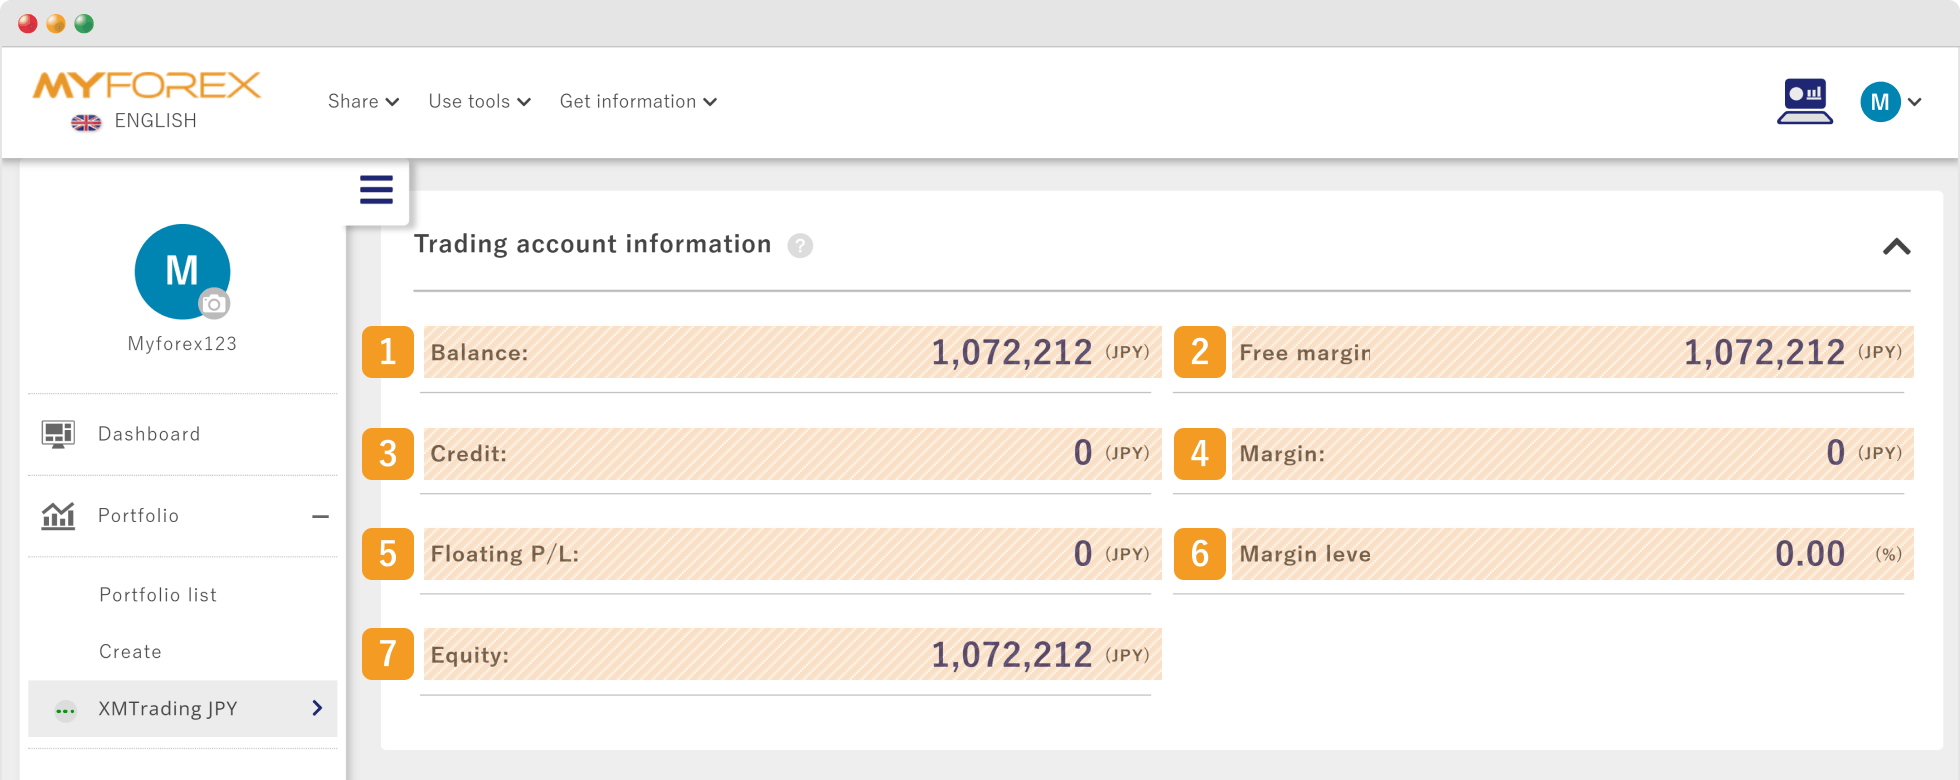
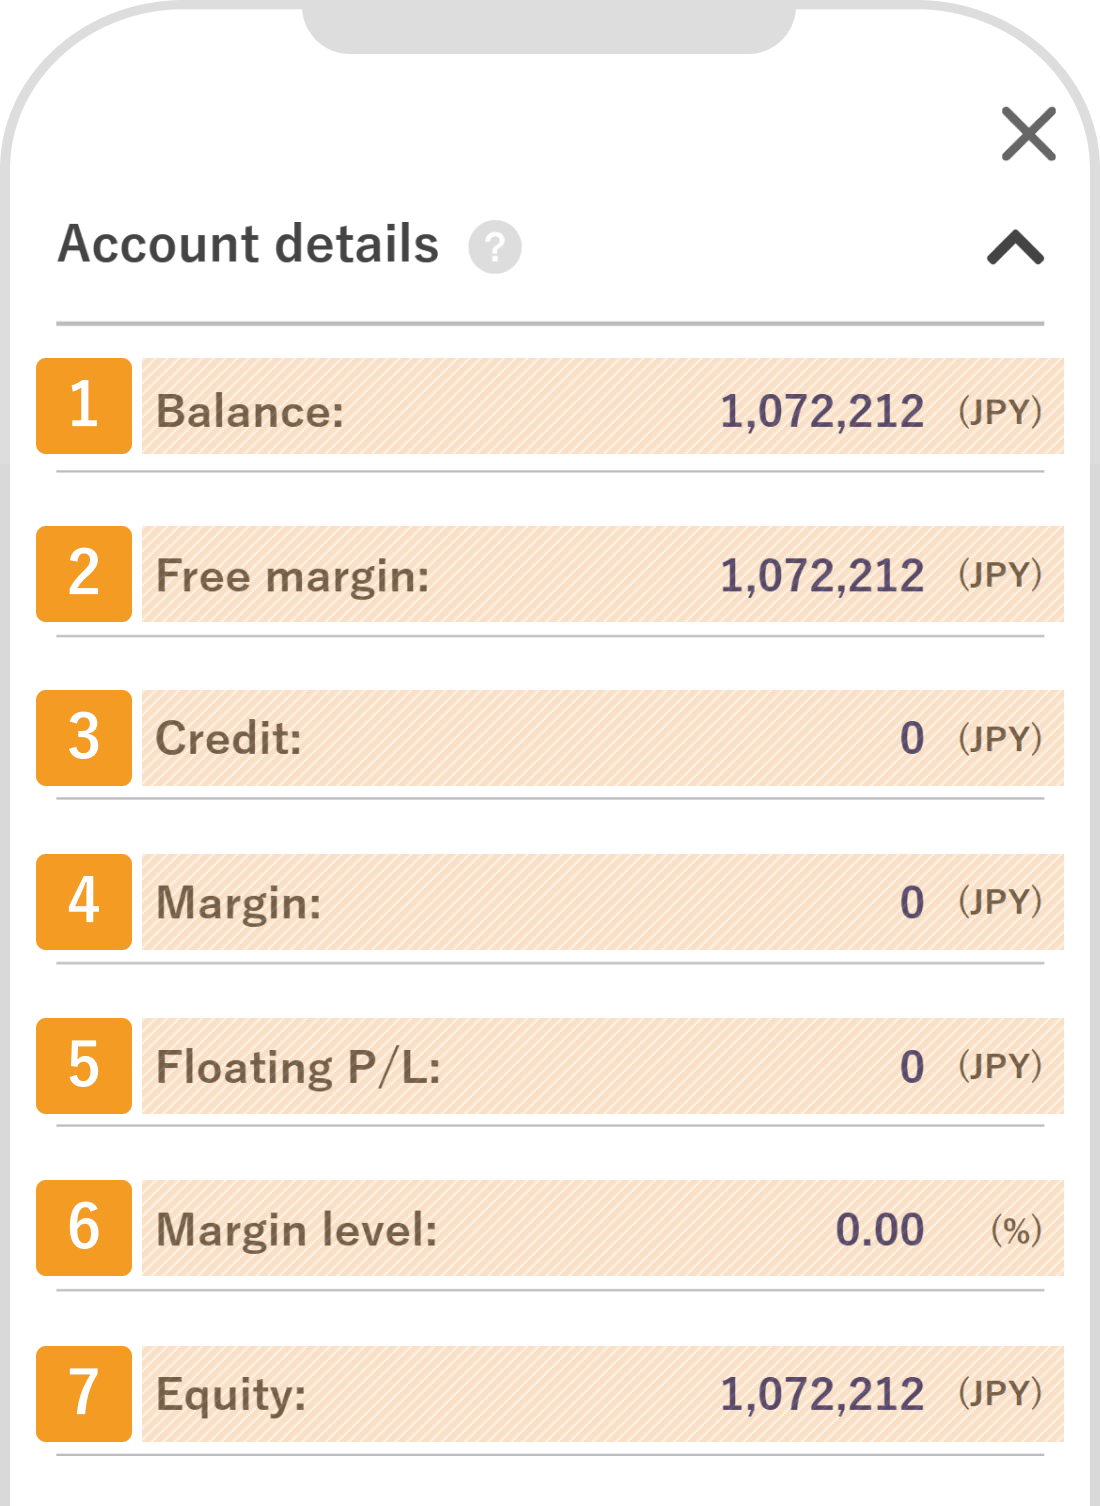
The Trading Account Information displays the amount taking into account the floating profit/loss of held positions.
Number | Item | Description |
|---|---|---|
1 | Balance | Displays the asset amount reflecting the profits/losses of closed trades and deposits/withdrawals. |
2 | Free Margin | Displays the amount of funds available for additional trades, calculated by subtracting the required margin from equity. |
3 | Credit | Displays the balance of non-withdrawable bonus margin. If a balance exists, margin is used from the account balance first. |
4 | Margin | Displays the minimum margin required to hold positions. |
5 | Floating P/L | Displays the unrealized profit/loss amount of open positions. |
6 | Margin level | Displays the percentage of equity relative to the required margin. |
7 | Equity | The amount of funds available for trading. If there is credit, the total amount of the balance and credit is displayed. If holding positions, the amount will reflect floating profits or losses. |
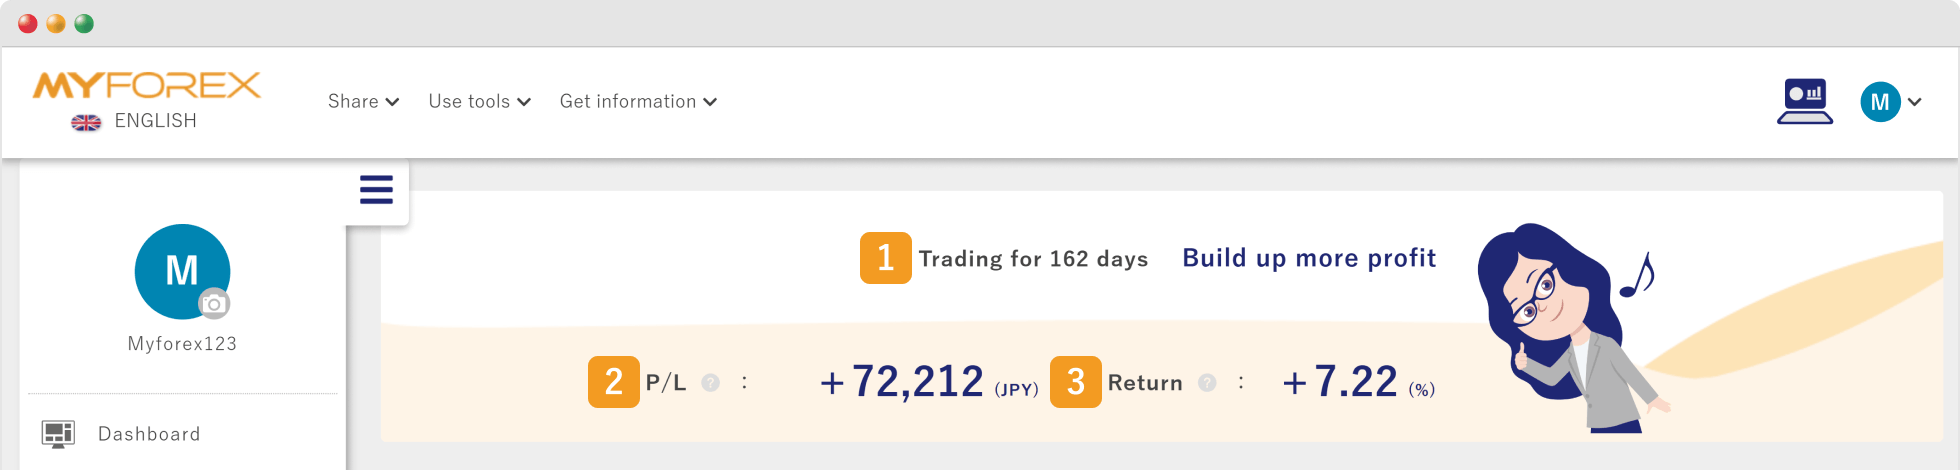
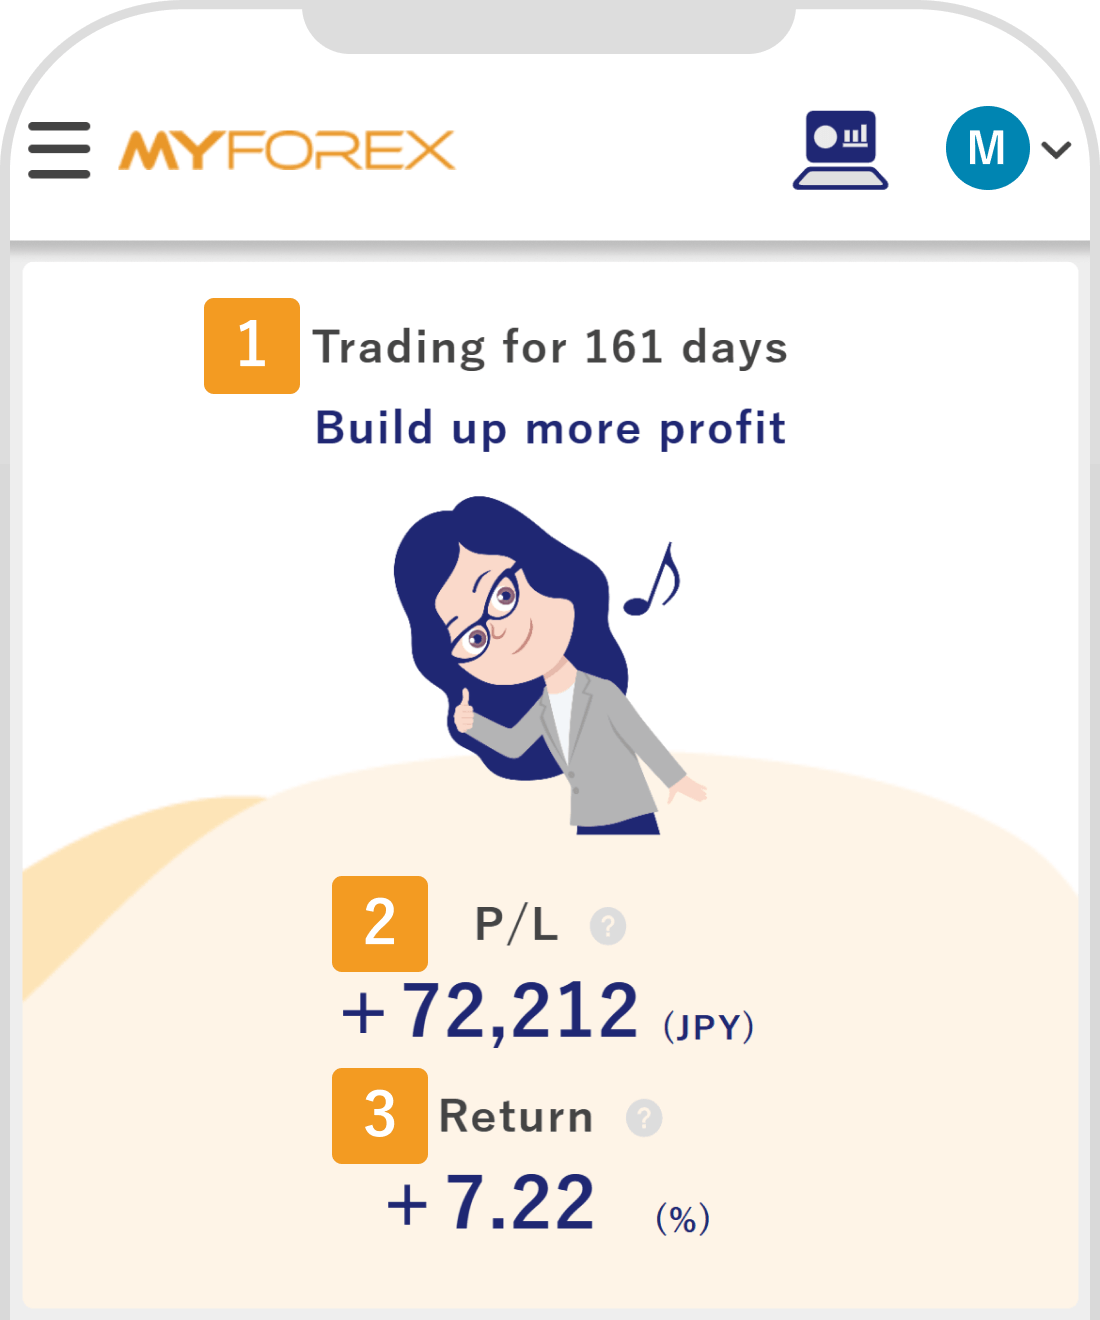
Displays the number of trading days of the account and the profit performance over the entire period.
Number | Item | Description |
|---|---|---|
1 | Trading days | Represents the total number of days from the date the first trade (or deposit/withdrawal) was made in the account to the present. |
2 | P/L | Shows the total of realized and unrealized profit and loss from the start of trading to the present. The "+" mark represents profit, and the "-" mark represents loss. |
3 | Return | The return rate indicates capital efficiency. It is calculated by dividing the profit by the total deposits. Return rate = (total realized P/L + unrealized P/L) ÷ total deposits × 100 (%) |
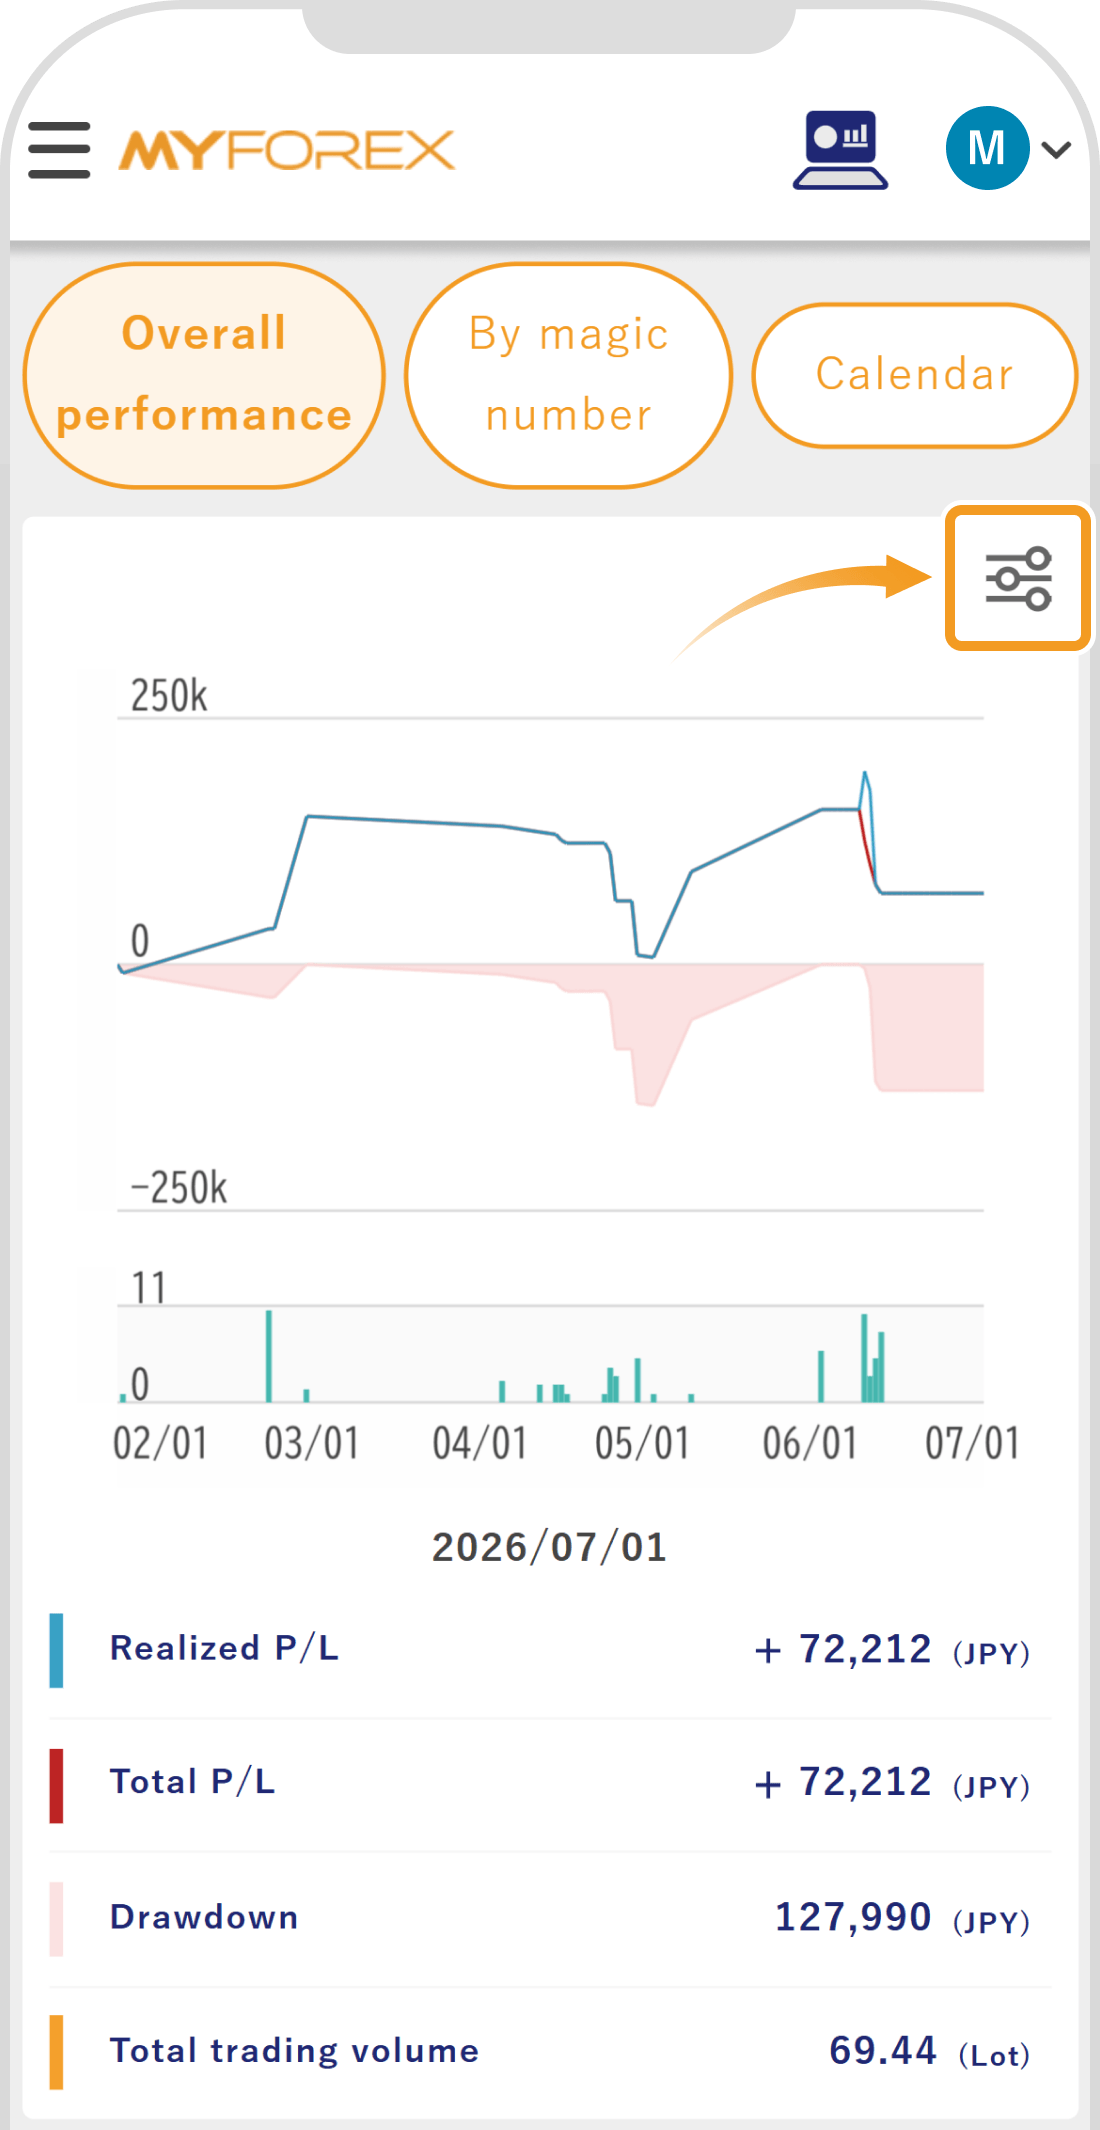
You can check changes in account assets and profits/losses on a chronological graph to intuitively grasp operational stability and drawdown.
Additionally, unnecessary items displayed on the graph can be hidden by clicking the "×" in the upper right corner of the card.
If you want to display them again or customize indicators (Balance, Drawdown, etc.), you can add them using the "+" button.
Additionally, unnecessary items displayed on the graph can be hidden via the settings in the upper right corner of the graph.
If you want to display them again or customize indicators (Balance, Drawdown, etc.), you can add them via the settings.
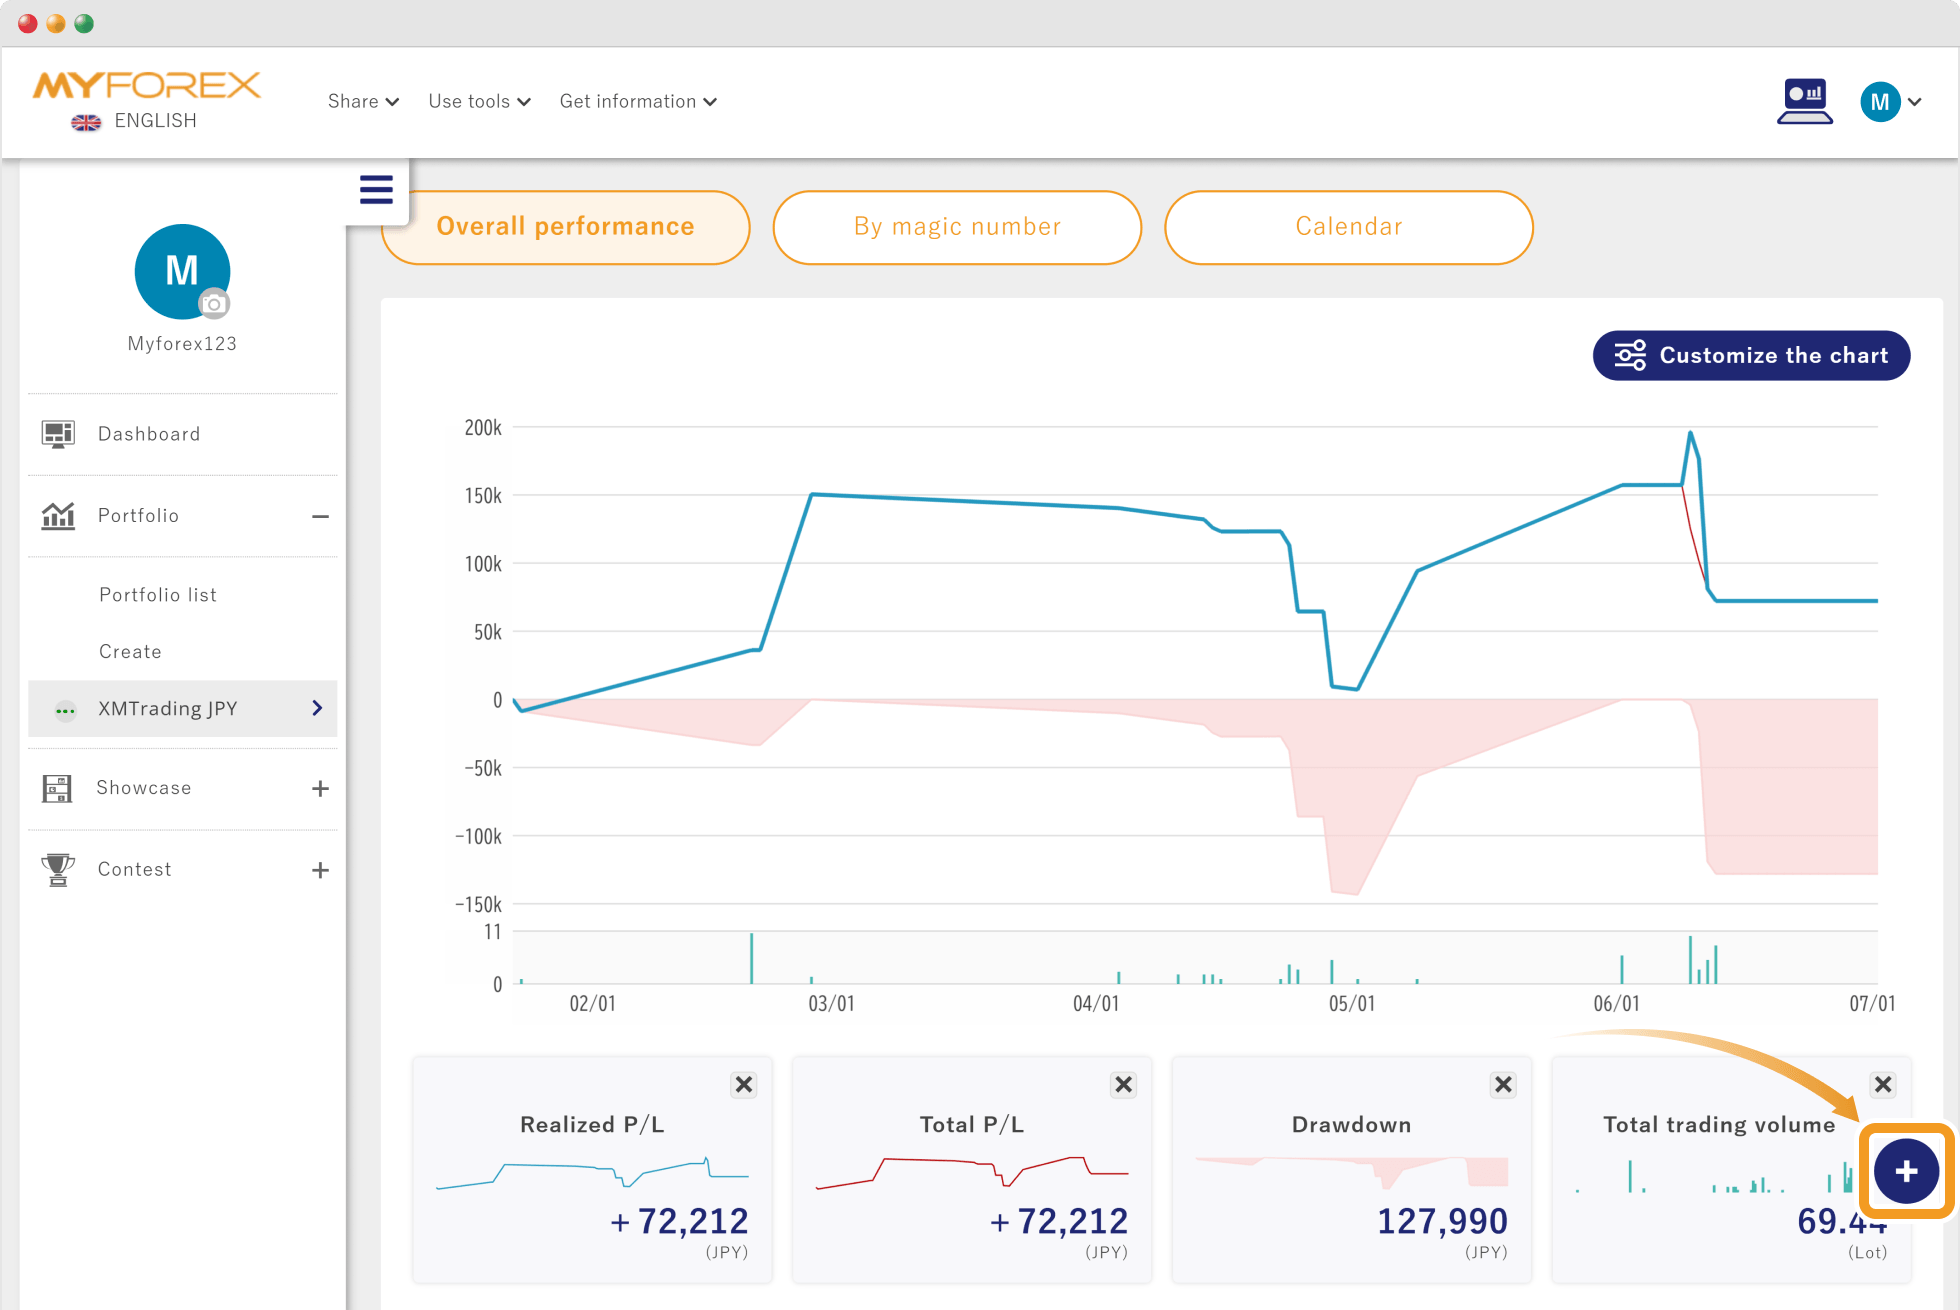
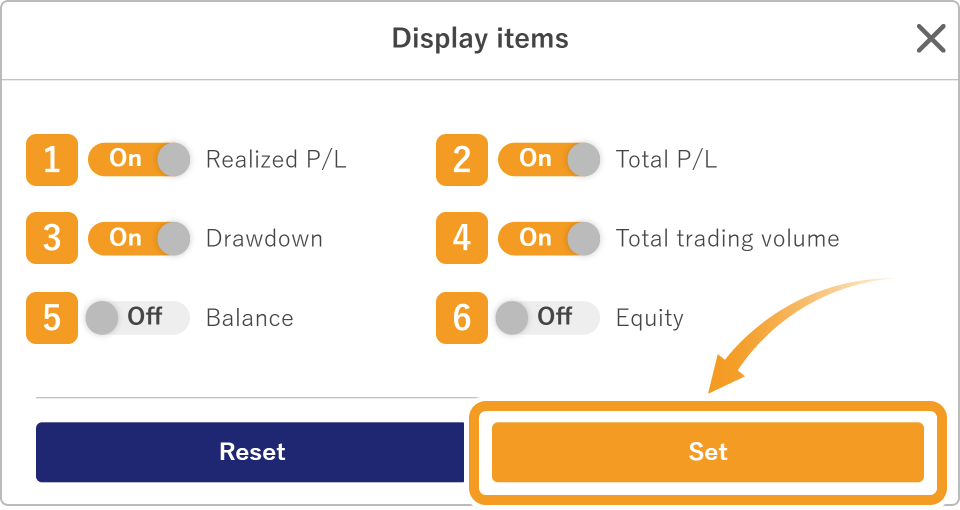
After clicking the "+" button, toggle ON the items you wish to display on the screen, and finally click "Set" to reflect them in the graph.
Please refer to the table below for details on each display item.
In the settings, select the items you wish to display on the screen, and finally tap "Set" to reflect them in the graph.
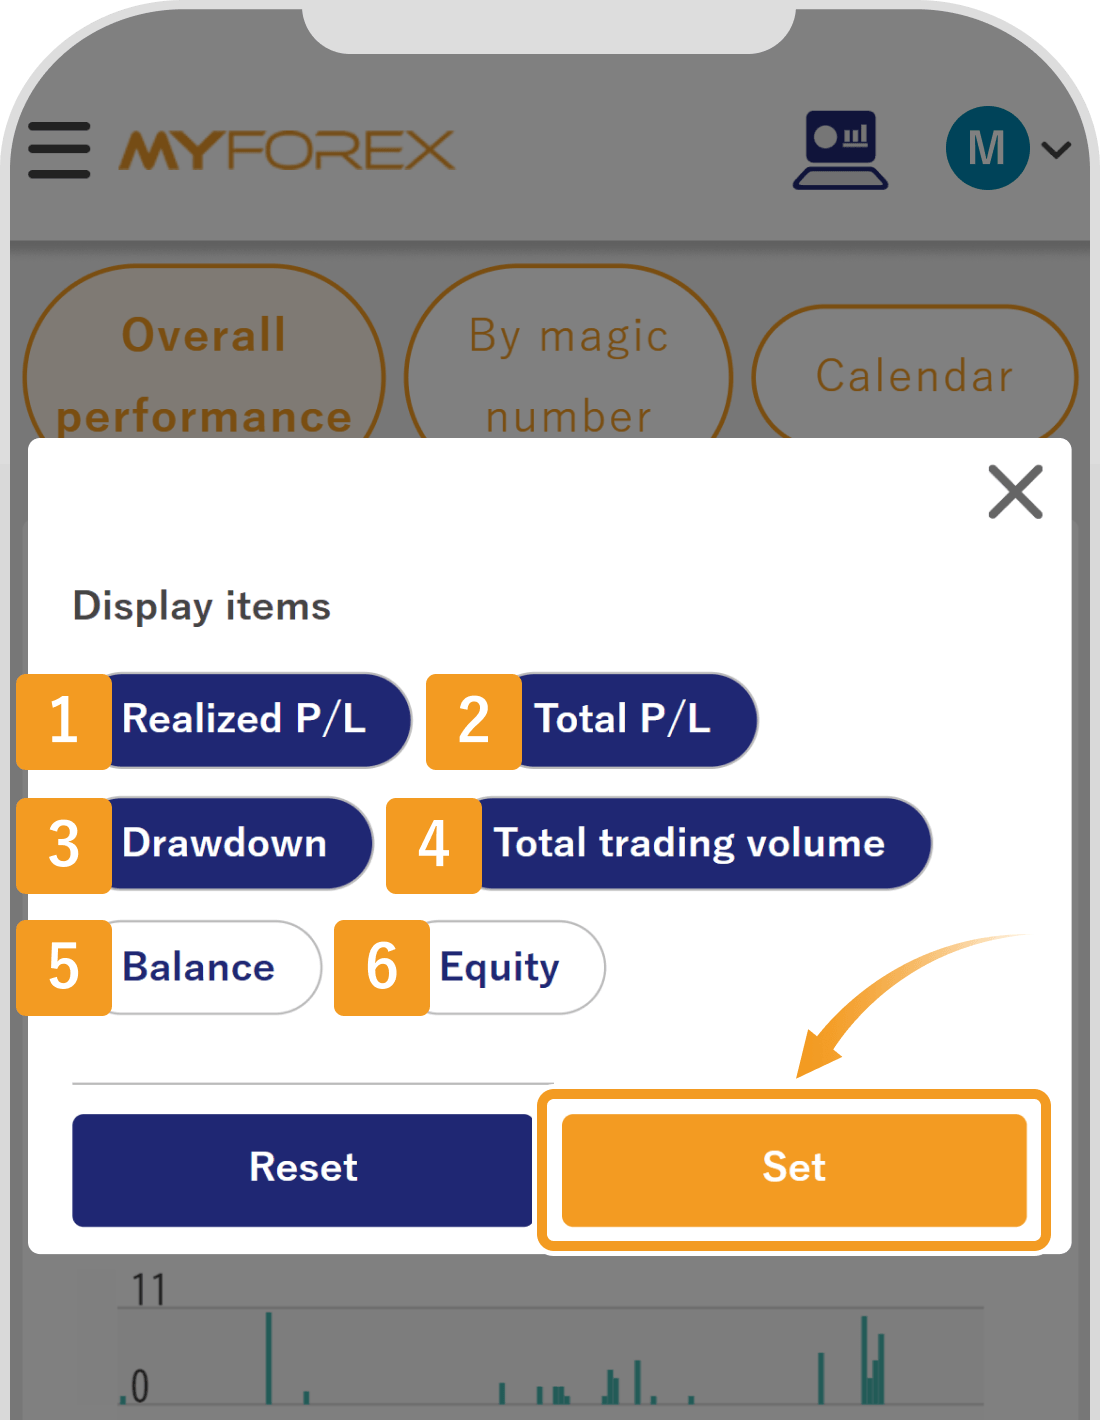
Number | Item | Description |
|---|---|---|
1 | Realized P/L | Blue line graph. Profits and losses generated when positions are closed. |
2 | Total P/L | Red line graph. Profit/loss reflecting floating profits/losses. Note that floating profit/loss data prior to portfolio linkage cannot be retrieved, so only closed profit/loss will be reflected in the graph for that period. |
3 | Drawdown | Area graph. Represents the balance drawdown amount (closed basis). |
4 | Total trading volume | Bar graph. Represents the trading volume (number of lots) to date. |
5 | Balance | Yellow line graph. Profits or losses are reflected in the balance when deposits/withdrawals are made or positions are closed. |
6 | Equity | Green line graph. Equity balance calculated by adding the floating profit/loss of open positions to the balance. Note that floating profit/loss data prior to portfolio linkage cannot be retrieved, so the balance without floating profit/loss will be displayed for that period. |
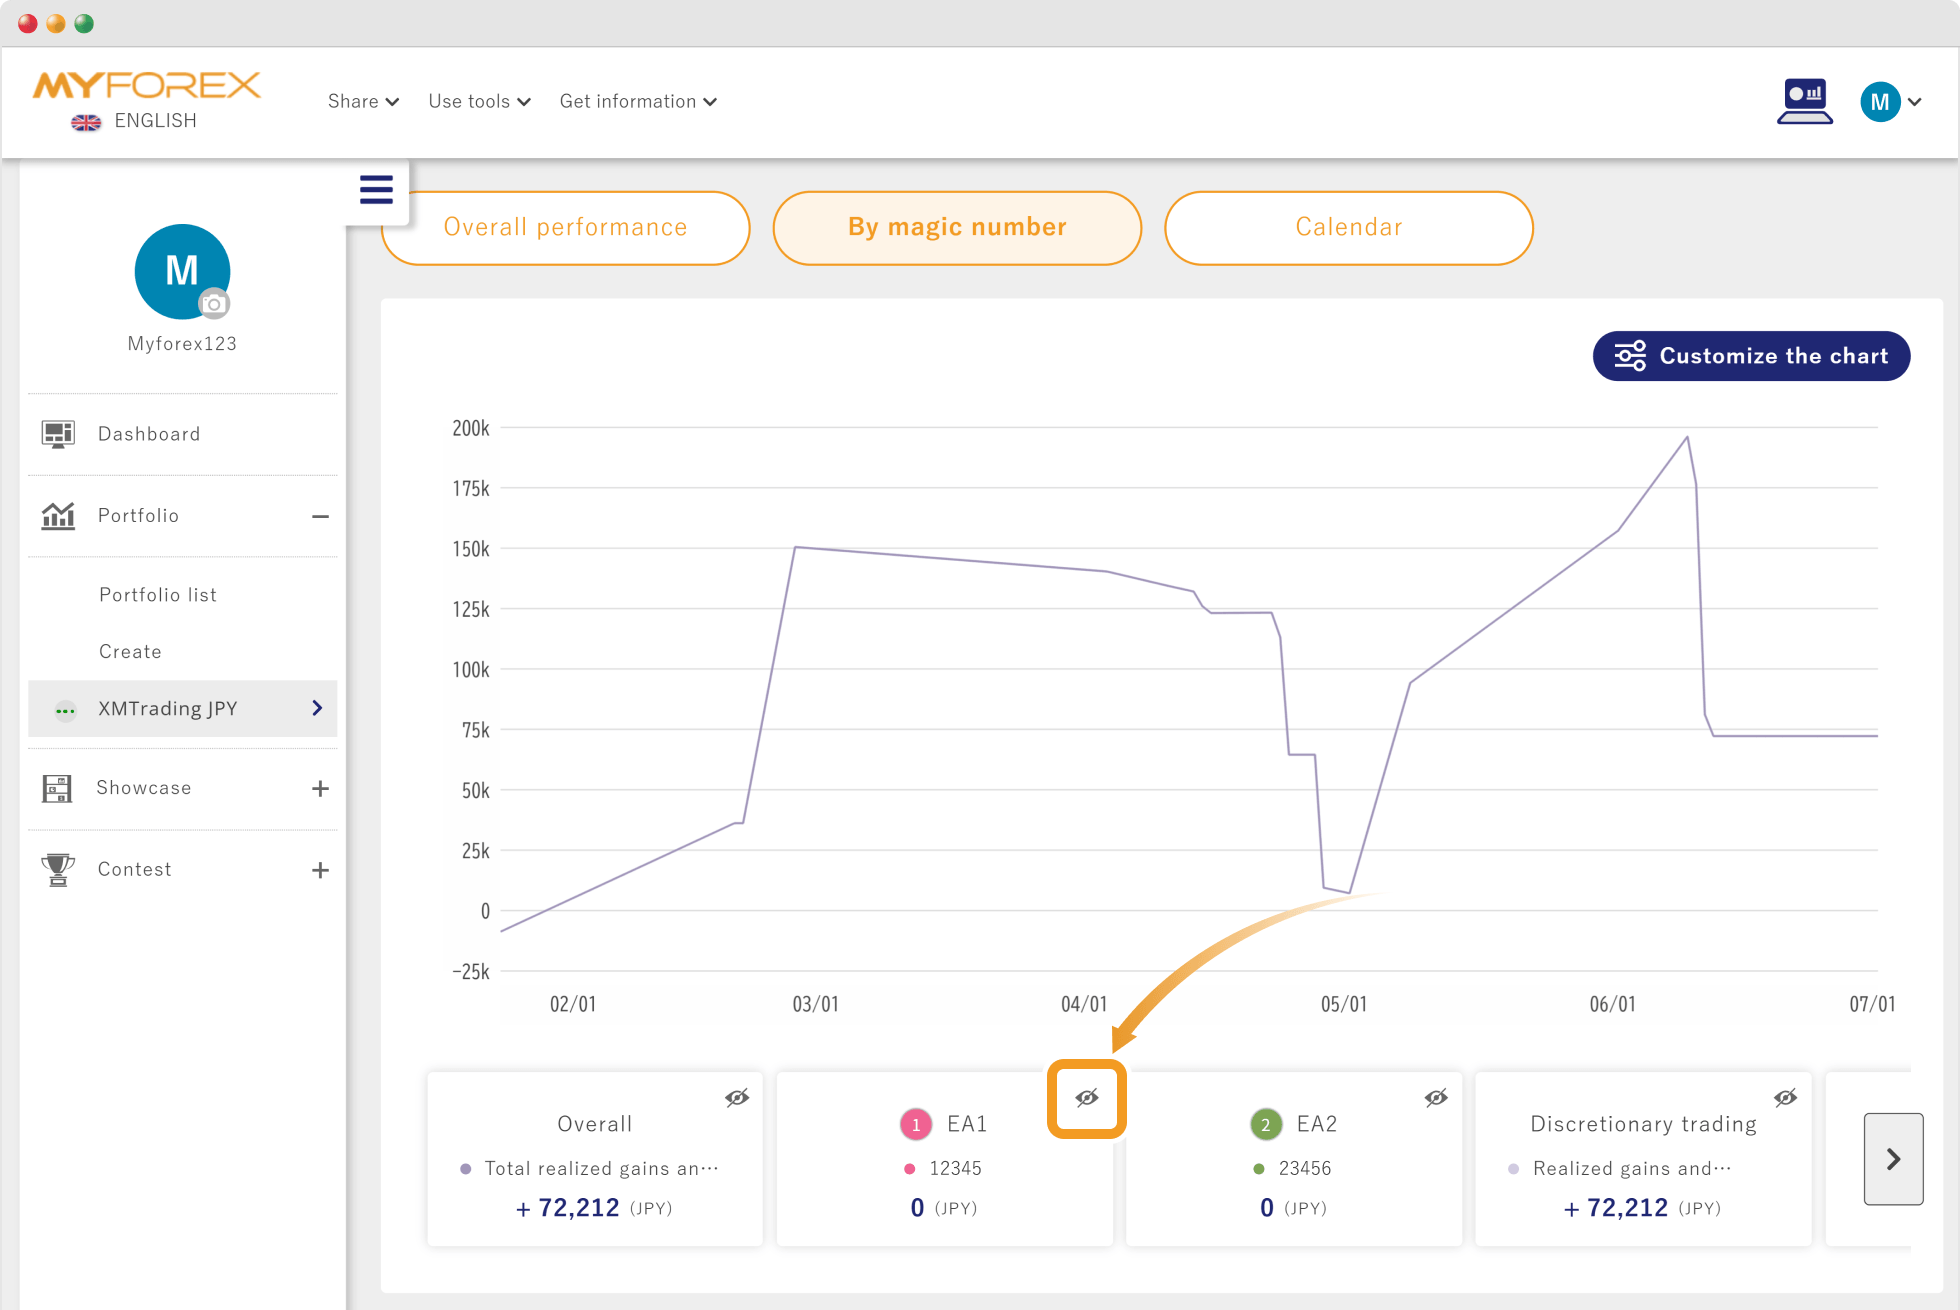
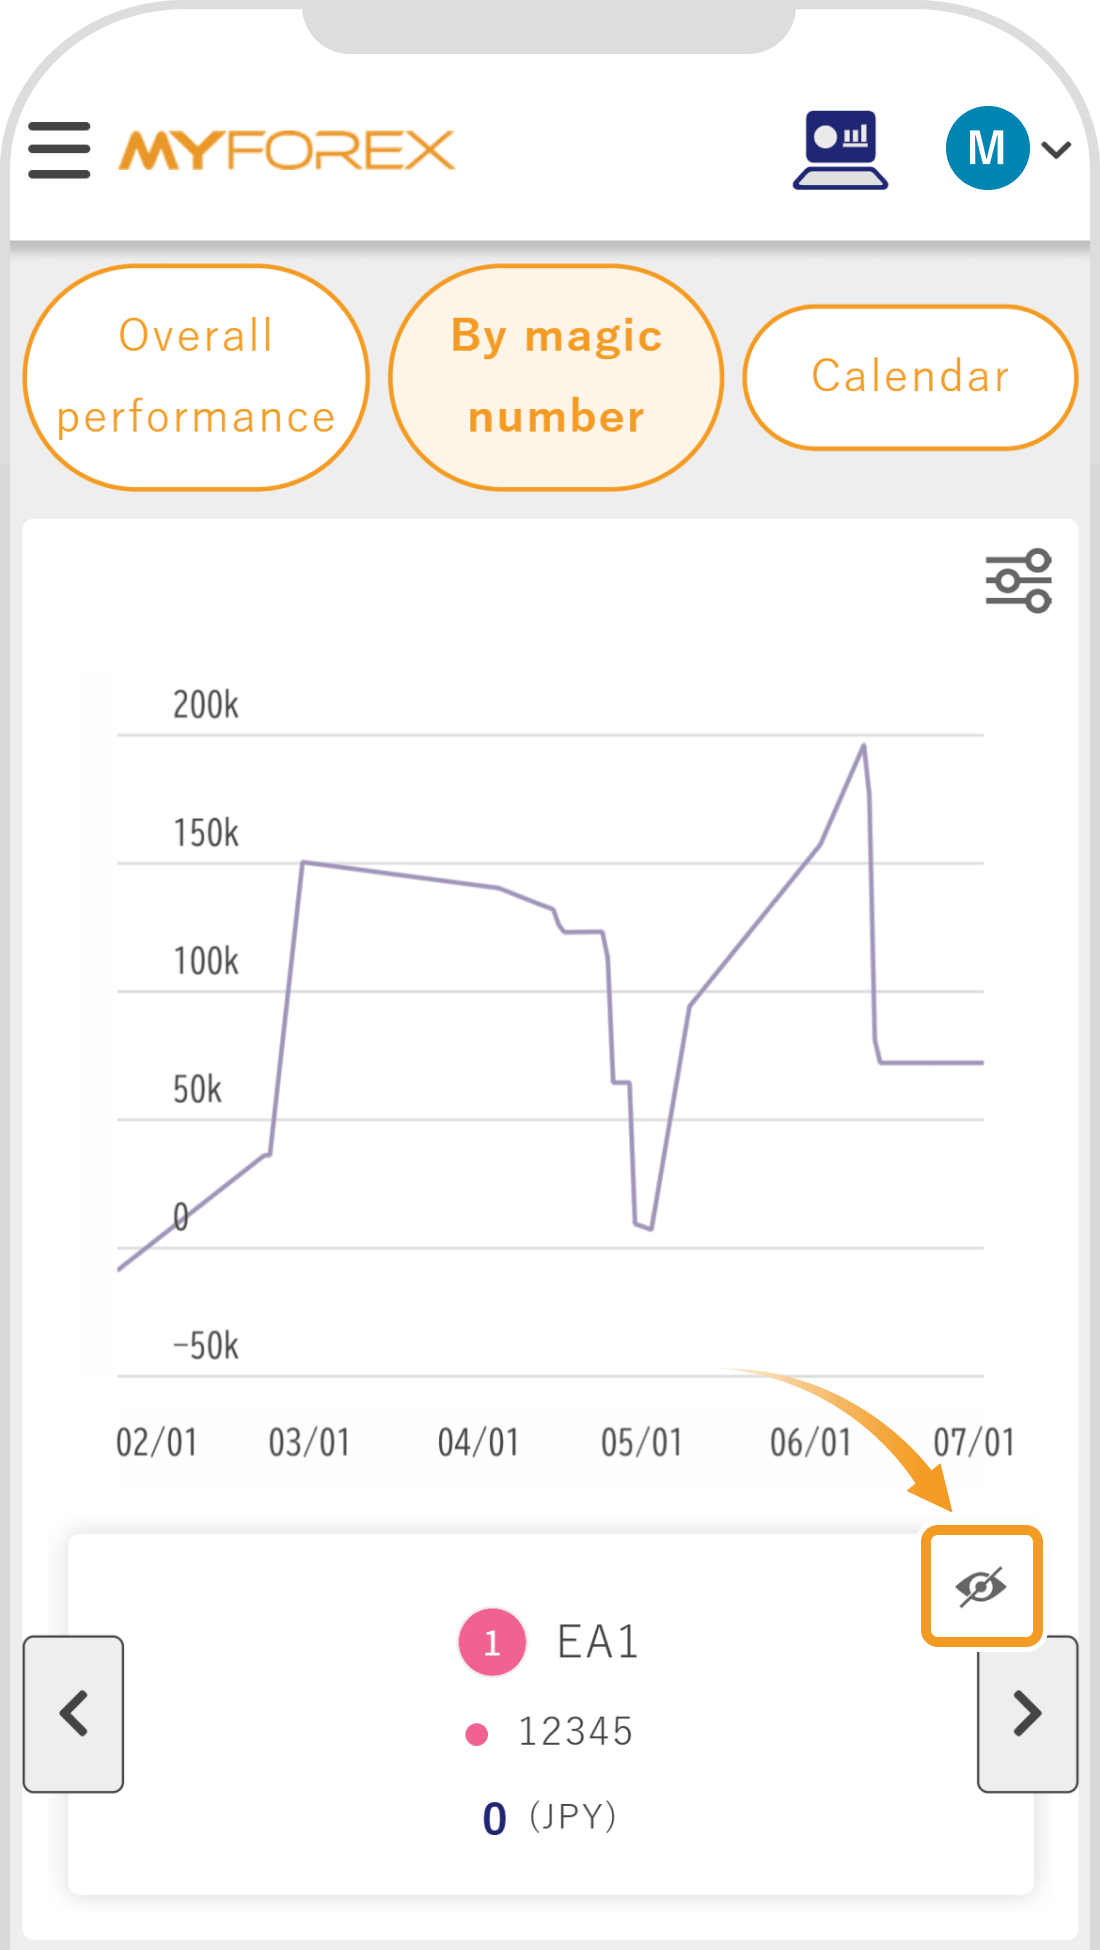
You can compare and analyze profit/loss changes chronologically by magic number using a line graph. This helps visually track the growth and drawdown status of each trading strategy, making it easier to determine performance trends.
By clicking the eye icon on the right side of each magic number, you can individually toggle the display of the graph associated with that magic number on or off.
By tapping the eye icon on the right side of each magic number, you can individually toggle the display of the graph associated with that magic number on or off.
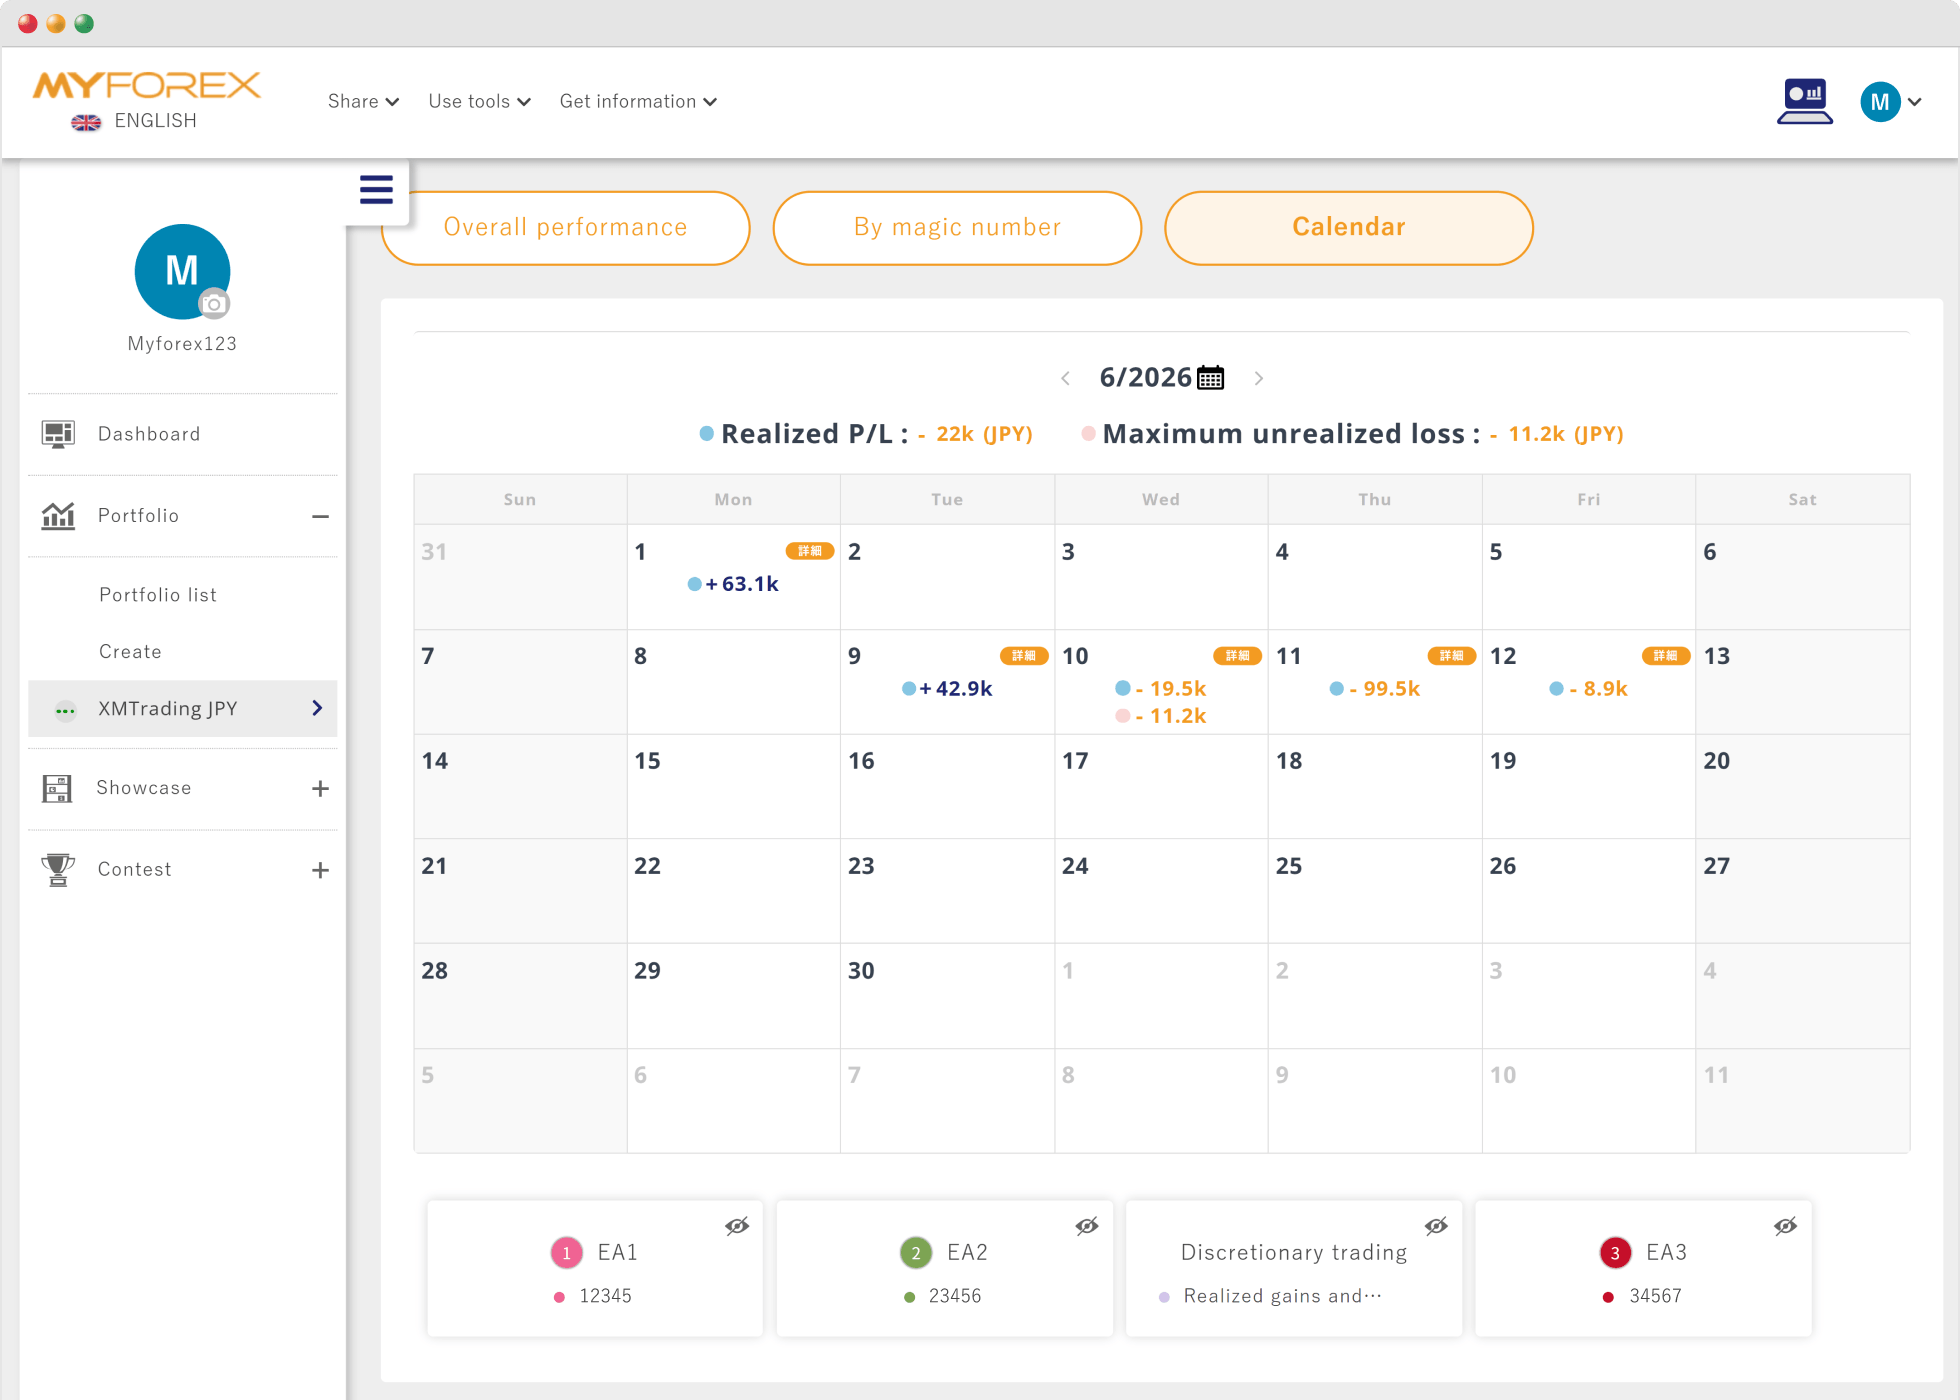
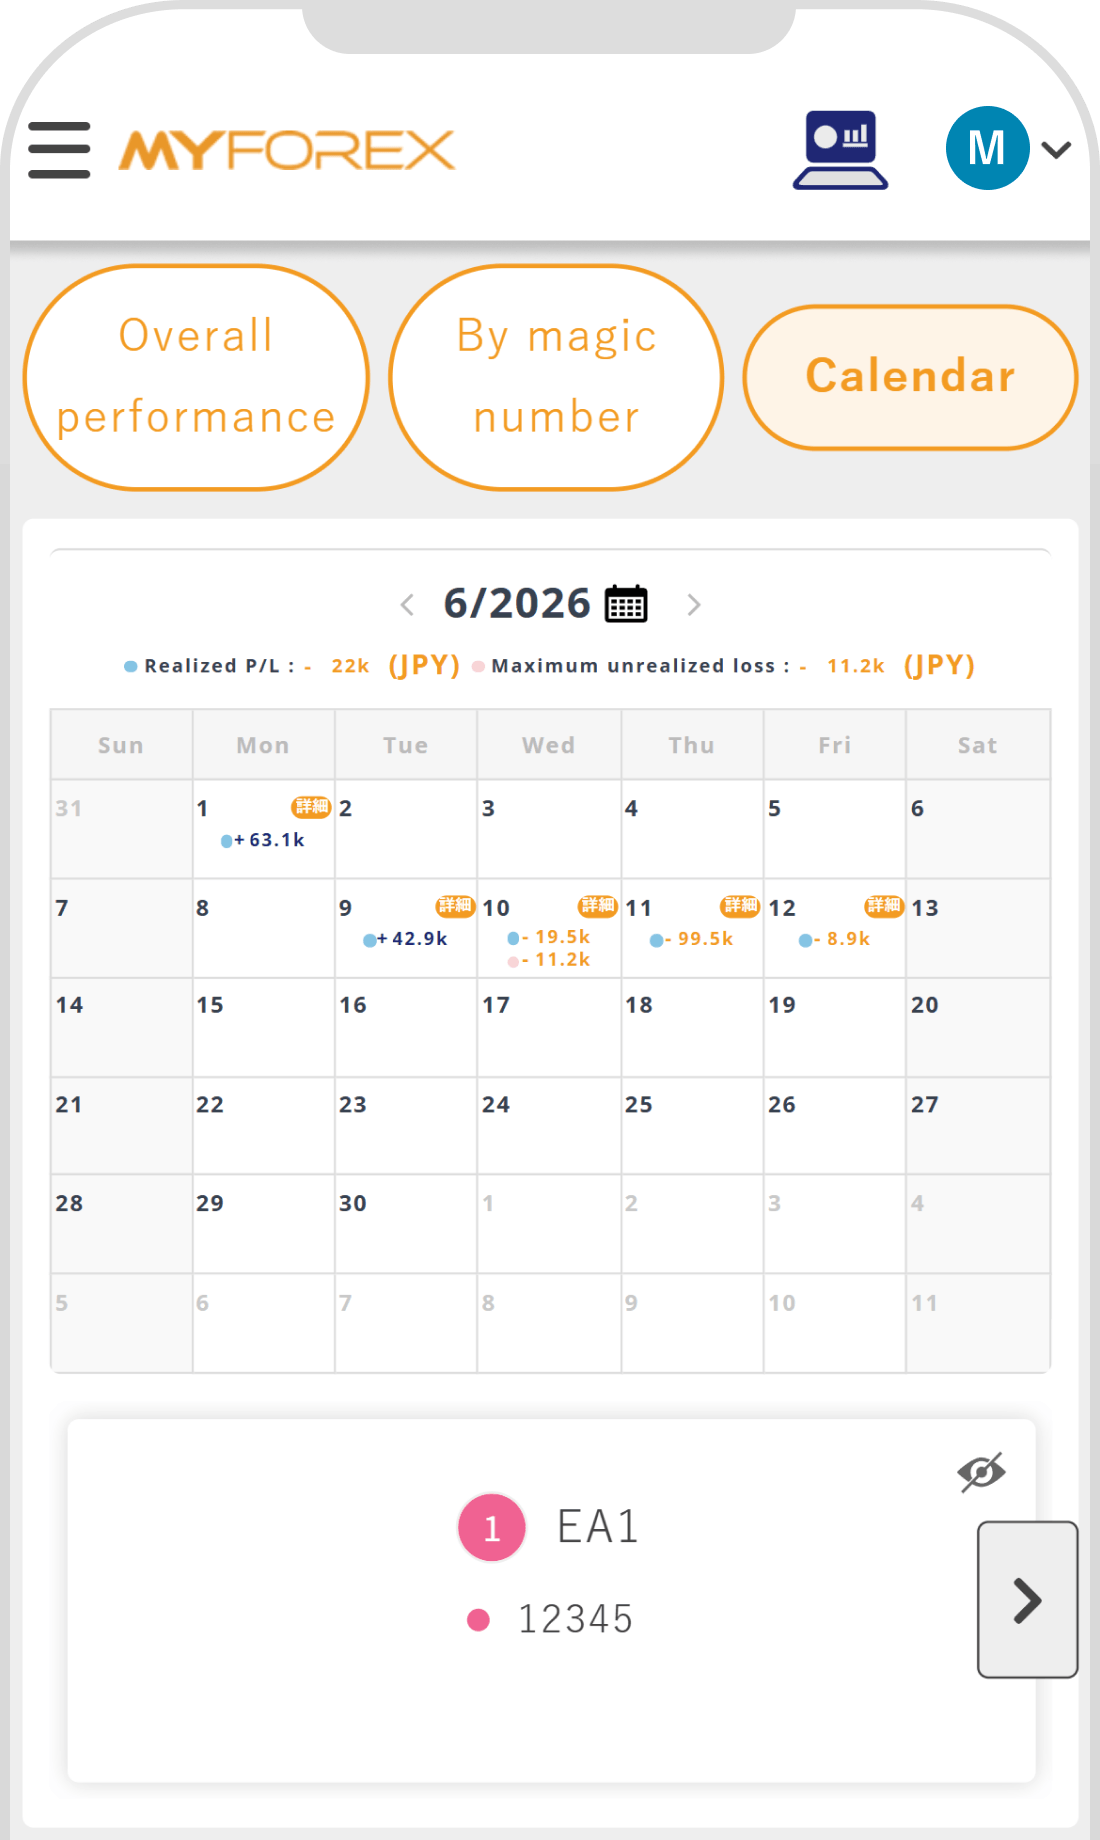
You can review daily closed profits/losses and maximum floating drawdown in a calendar format. This is useful for identifying day-of-the-week trends and visually understanding how much profit or loss occurred on specific days.
Note that maximum floating drawdown data prior to portfolio linkage cannot be retrieved and will not be displayed.
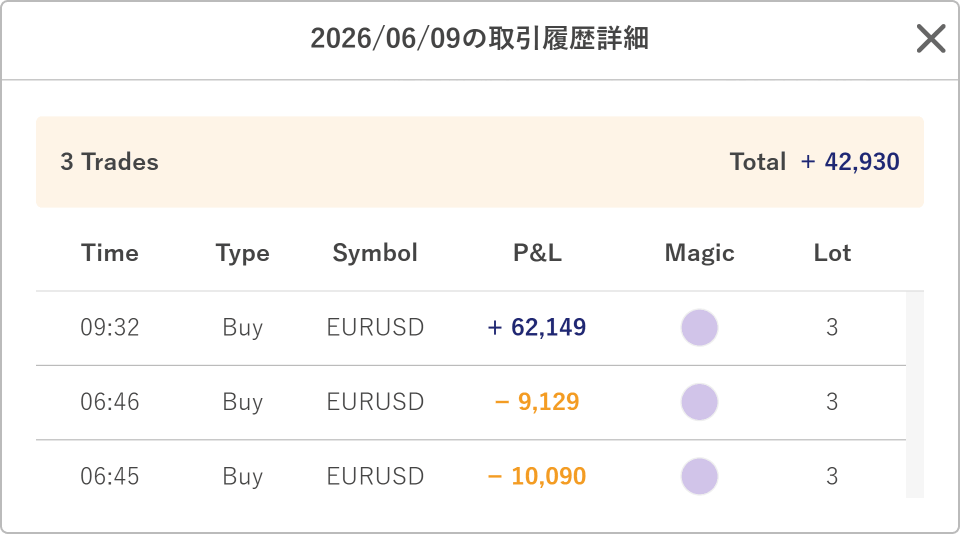
Additionally, clicking a specific date will display the details of the transaction history performed on that day.
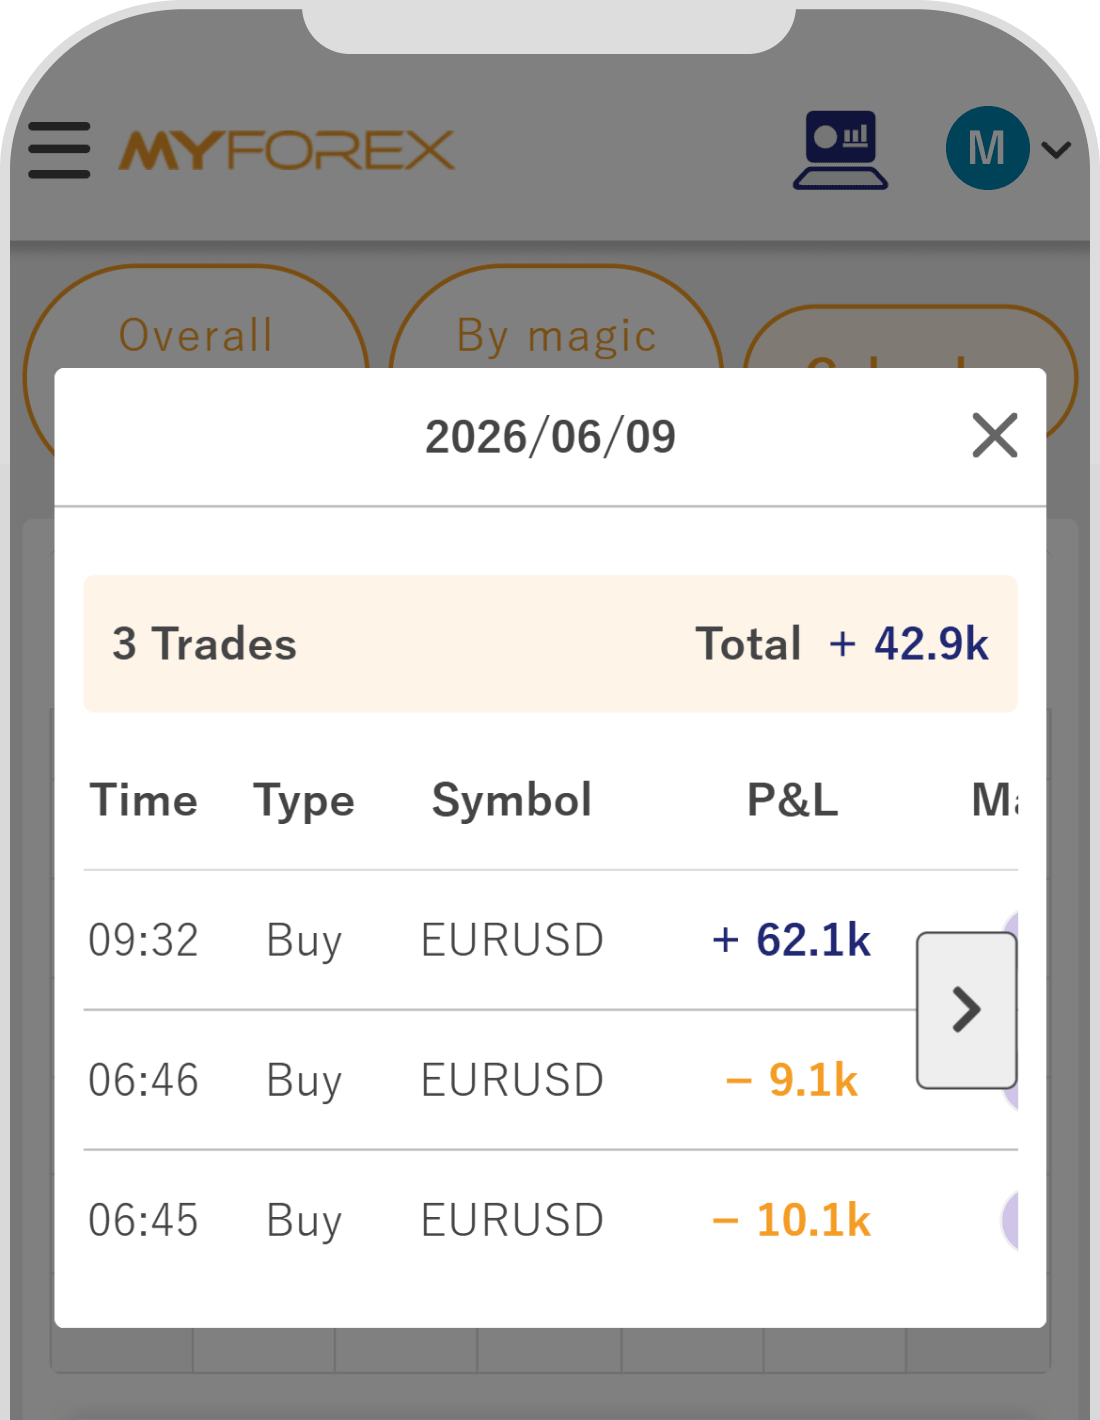
Additionally, tapping a specific date will display the details of the transaction history performed on that day.
In the details section, you can individually check the close time, buy/sell type, symbol name (such as currency pair), profit/loss, Magic Number, and number of lots for each trade.
Displays statistical data of earnings and trade performance within a certain period for each trading account.
Please note that Statistics are aggregated on a closed basis and do not include unrealized profits or losses.
You can also customize the displayed items according to your objectives.
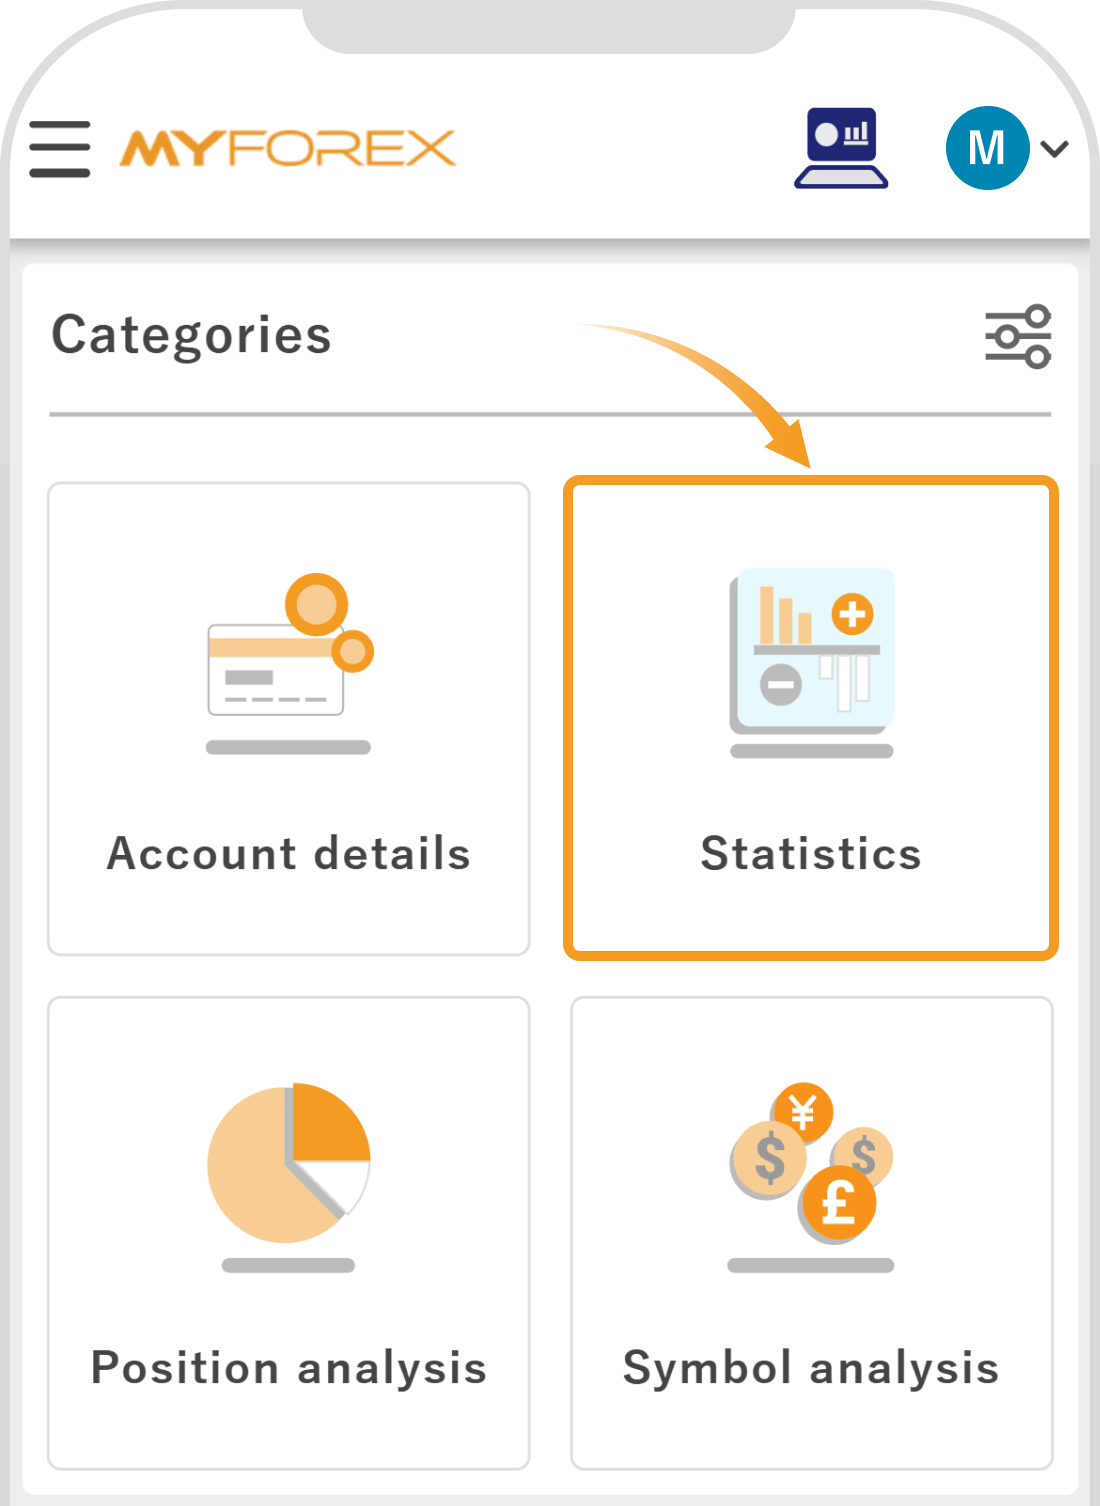
Tap "Statistics" in the Categories section.
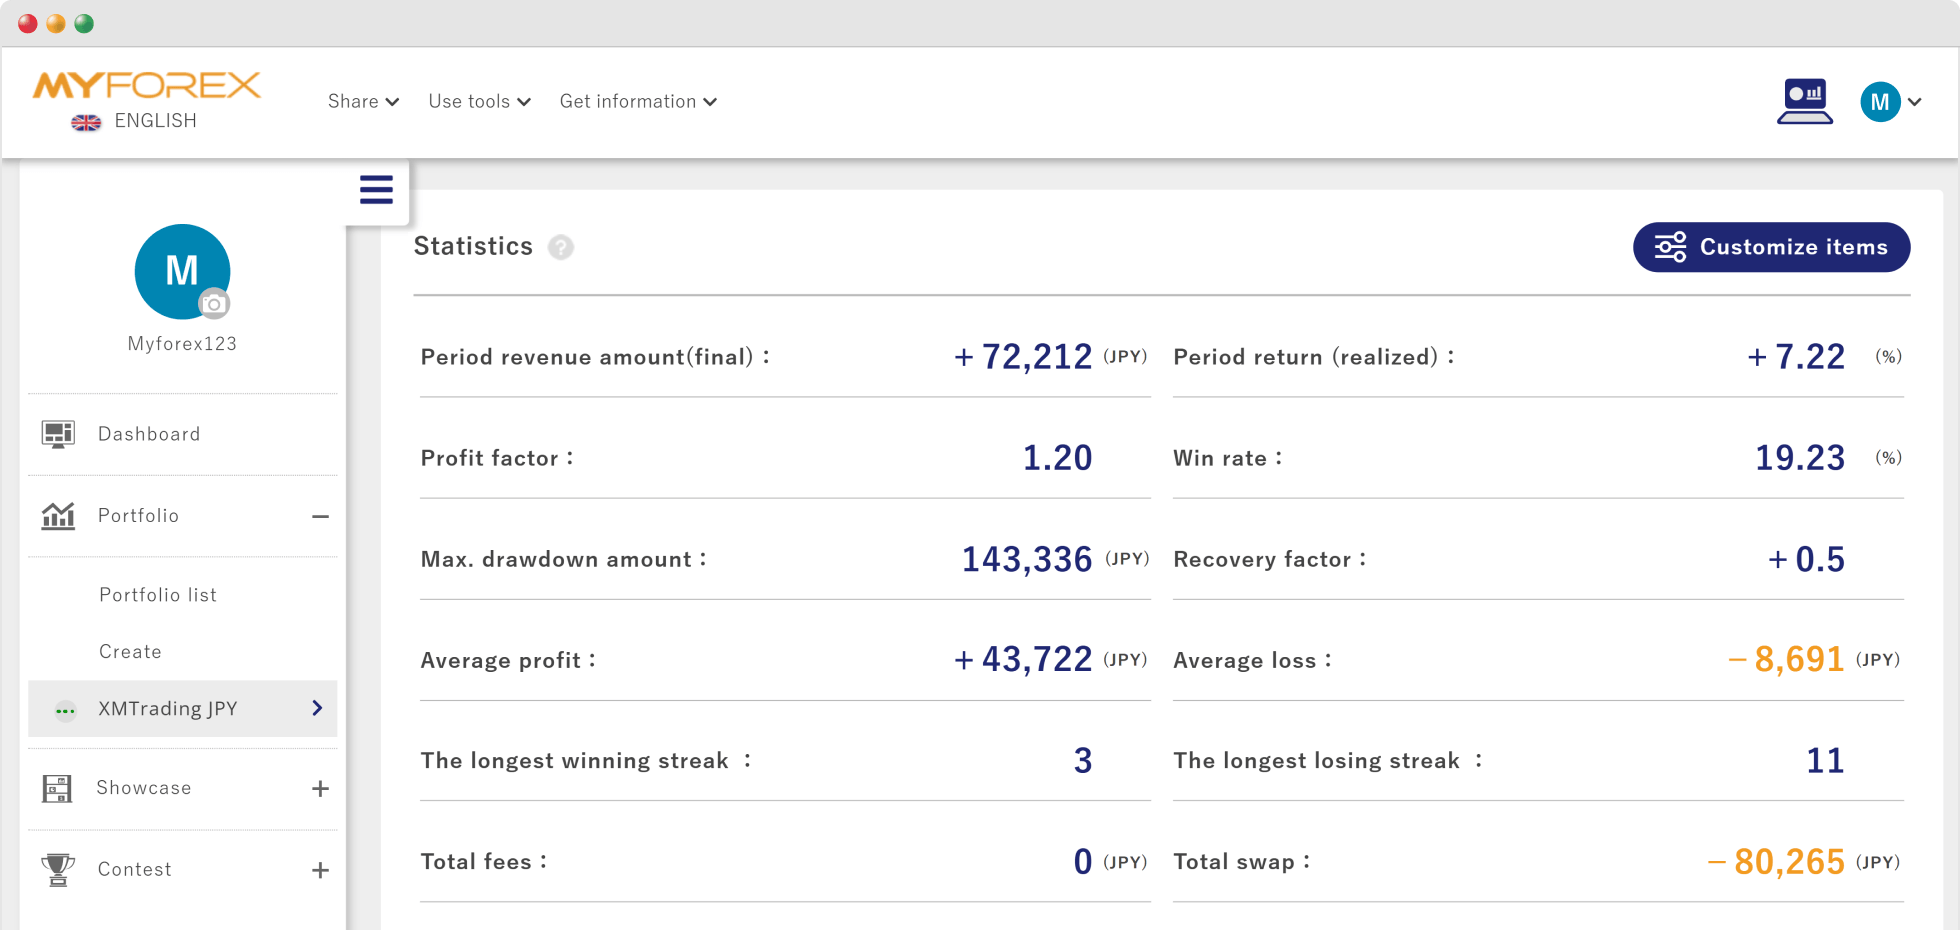
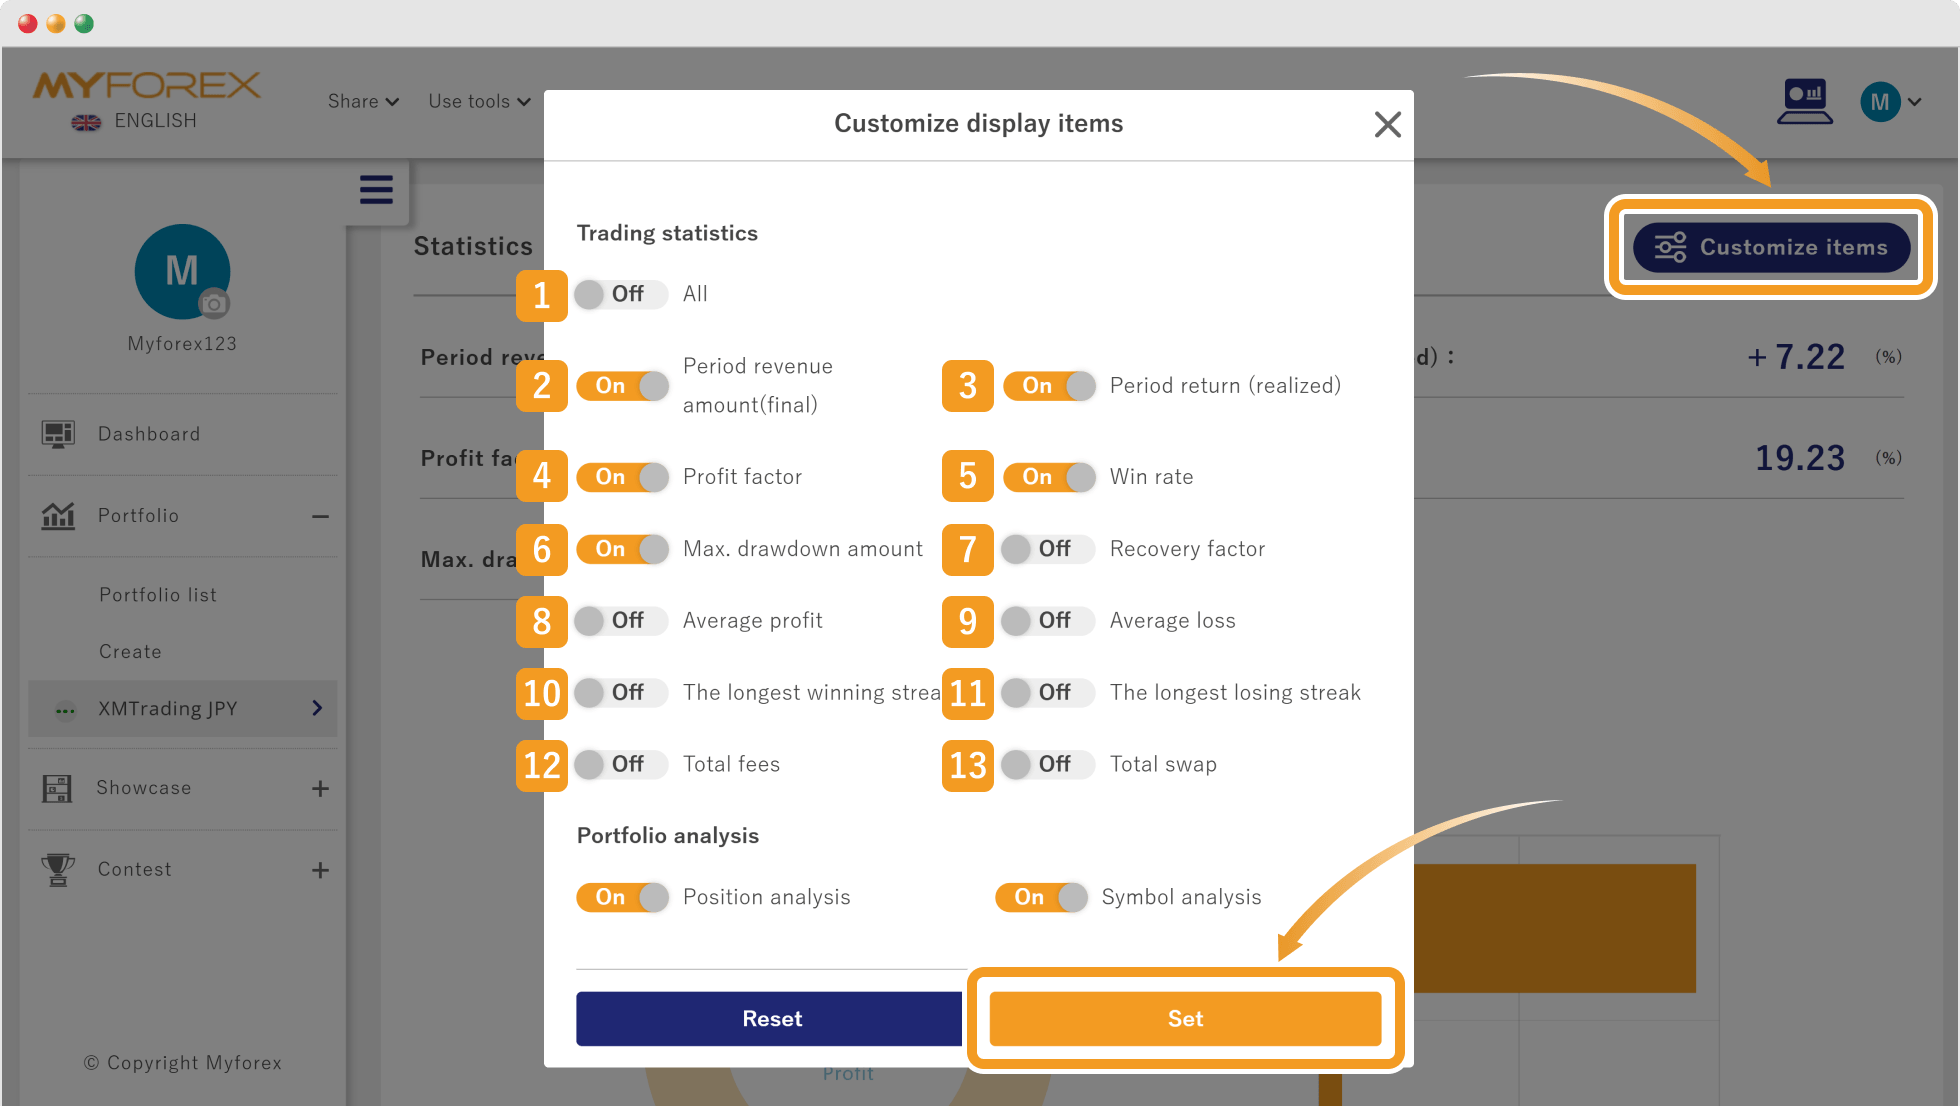
To customize the display items, click the "Customize items" button on the right side of the Statistics screen.
Toggle ON the items you want to display on the screen, and toggle OFF the items you want to hide.
Once selected, click "Set" to apply the changes to the portfolio screen.
Please refer to the following section for the meanings and calculation methods of profits, losses, and margins.
Number | Item | Description |
|---|---|---|
1 | All | Shows or hides all items. |
2 | Period revenue amount (final) | Closed profit/loss within the period. |
3 | Period return (realized) | Displays the return rate during the period. Closed profit/loss within the period ÷ (Balance at the beginning of the period + Total deposit amount) × 100 (%) |
4 | Profit factor | The profit divided by the loss for a given period. Profit factor = total profit ÷ total loss |
5 | Win rate | The ratio of the winning trades. Number of winning trades ÷ total trades × 100 |
6 | Max. drawdown amount | The maximum decrease in the balance. |
7 | Recovery factor | An indicator showing how efficiently assets recovered from the maximum drawdown. |
8 | Average profit | Average profit amount per winning trade. |
9 | Average loss | Average loss amount per losing trade. |
10 | The longest winning streak | The maximum number of consecutive trades that resulted in a profit. |
11 | The longest losing streak | The maximum number of consecutive trades that resulted in a loss. |
12 | Total fees | The total amount of round-turn commissions paid to the broker during trading. |
13 | Total swap | The total amount of swap points generated when holding positions overnight. |
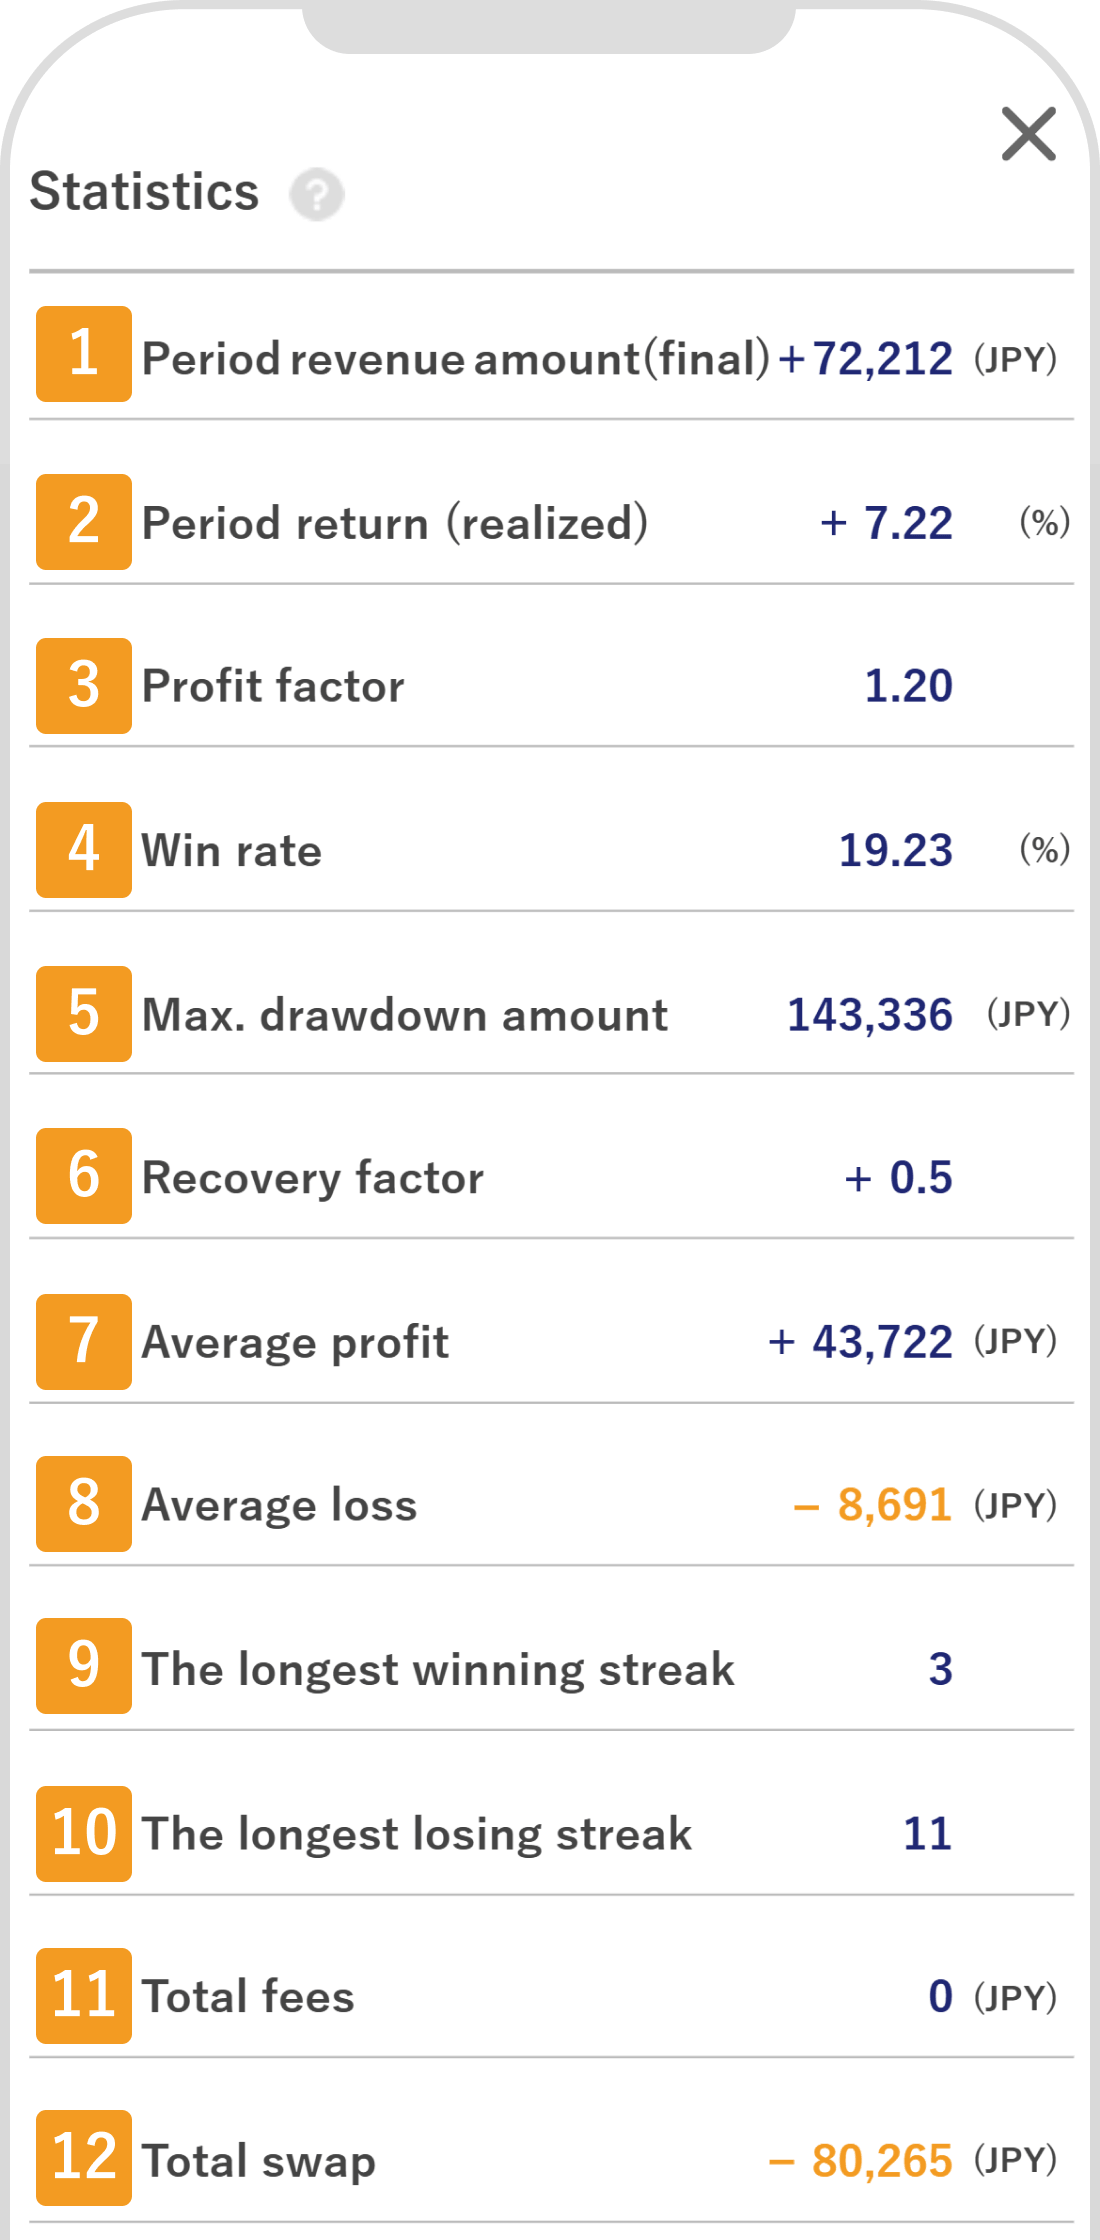
Number | Item | Description |
|---|---|---|
1 | Period revenue amount (final) | Closed profit/loss within the period. |
2 | Period return (realized) | Displays the return rate during the period. Closed profit/loss within the period ÷ (Balance at the beginning of the period + Total deposit amount) × 100 (%) |
3 | Profit factor | The profit divided by the loss for a given period. Profit factor = total profit ÷ total loss |
4 | Win rate | The ratio of the winning trades. Number of winning trades ÷ total trades × 100 |
5 | Max. drawdown amount | The maximum decrease in the balance. |
6 | Recovery factor | An indicator showing how efficiently assets recovered from the maximum drawdown. |
7 | Average profit | Average profit amount per winning trade. |
8 | Average loss | Average loss amount per losing trade. |
9 | The longest winning streak | The maximum number of consecutive trades that resulted in a profit. |
10 | The longest losing streak | The maximum number of consecutive trades that resulted in a loss. |
11 | Total fees | The total amount of round-turn commissions paid to the broker during trading. |
12 | Total swap | The total amount of swap points generated when holding positions overnight. |
Position Analysis divides your past trades into Profit trades and Loss trades, showing the breakdown of Long positions and Short positions.
Use this to understand trends in your order frequency and profit/loss ratios to help guide your future trading strategy.
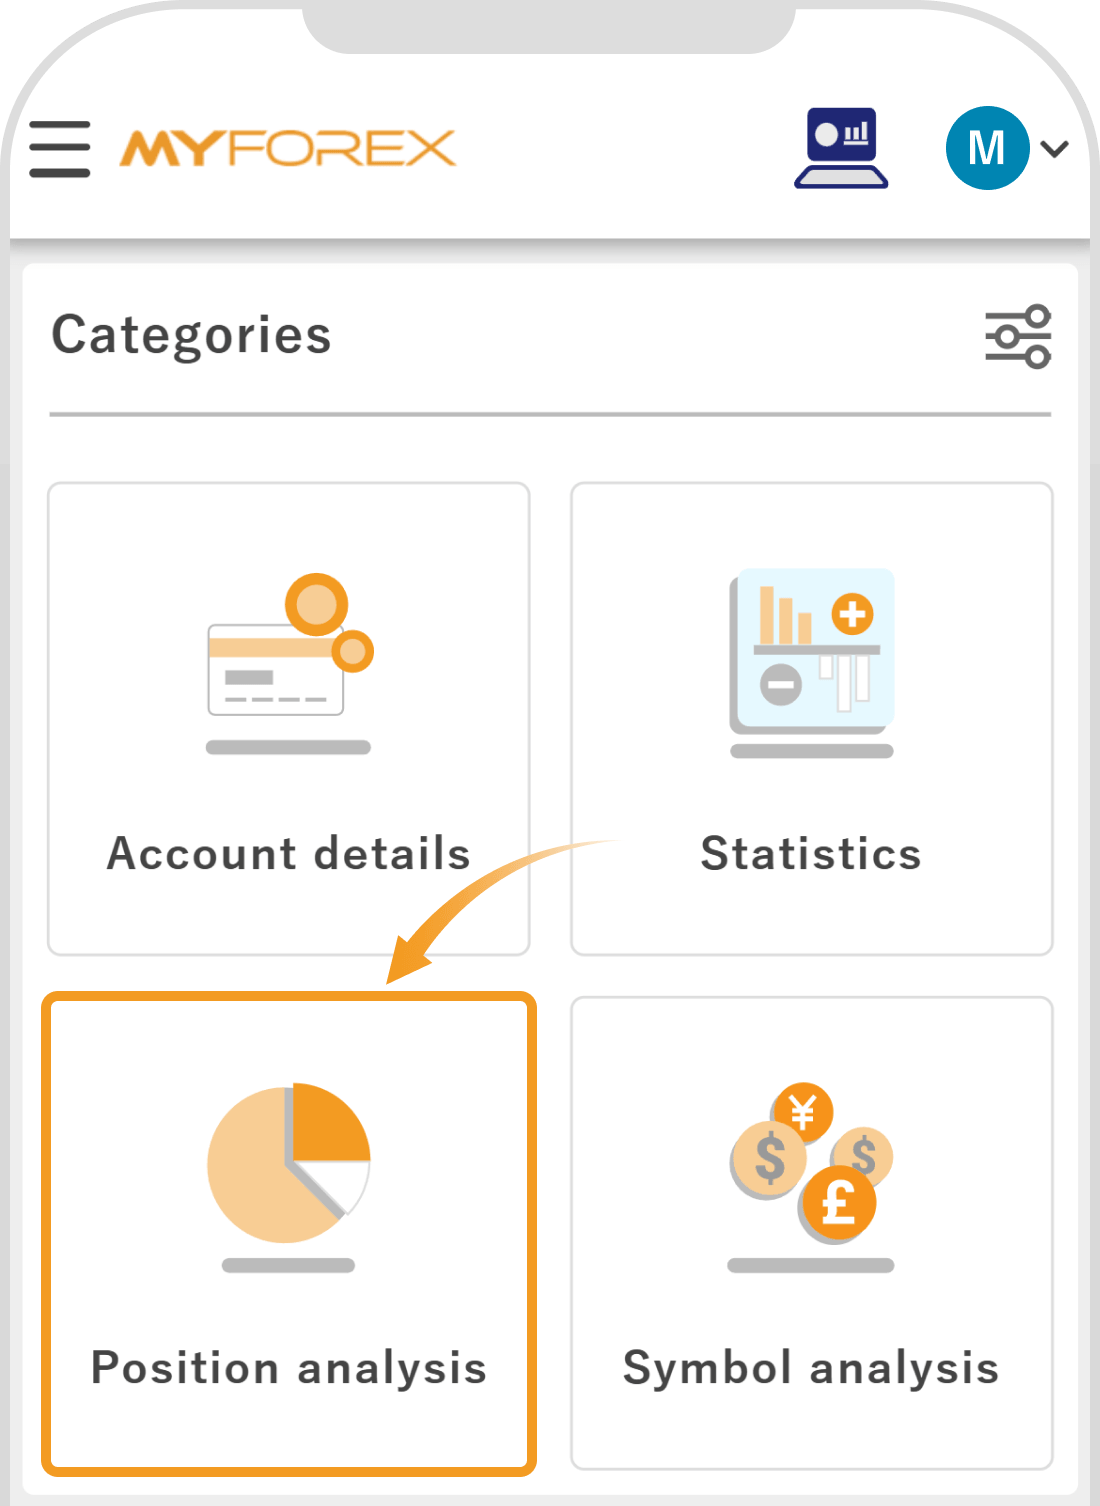
Please tap "Position analysis" in the Categories section.
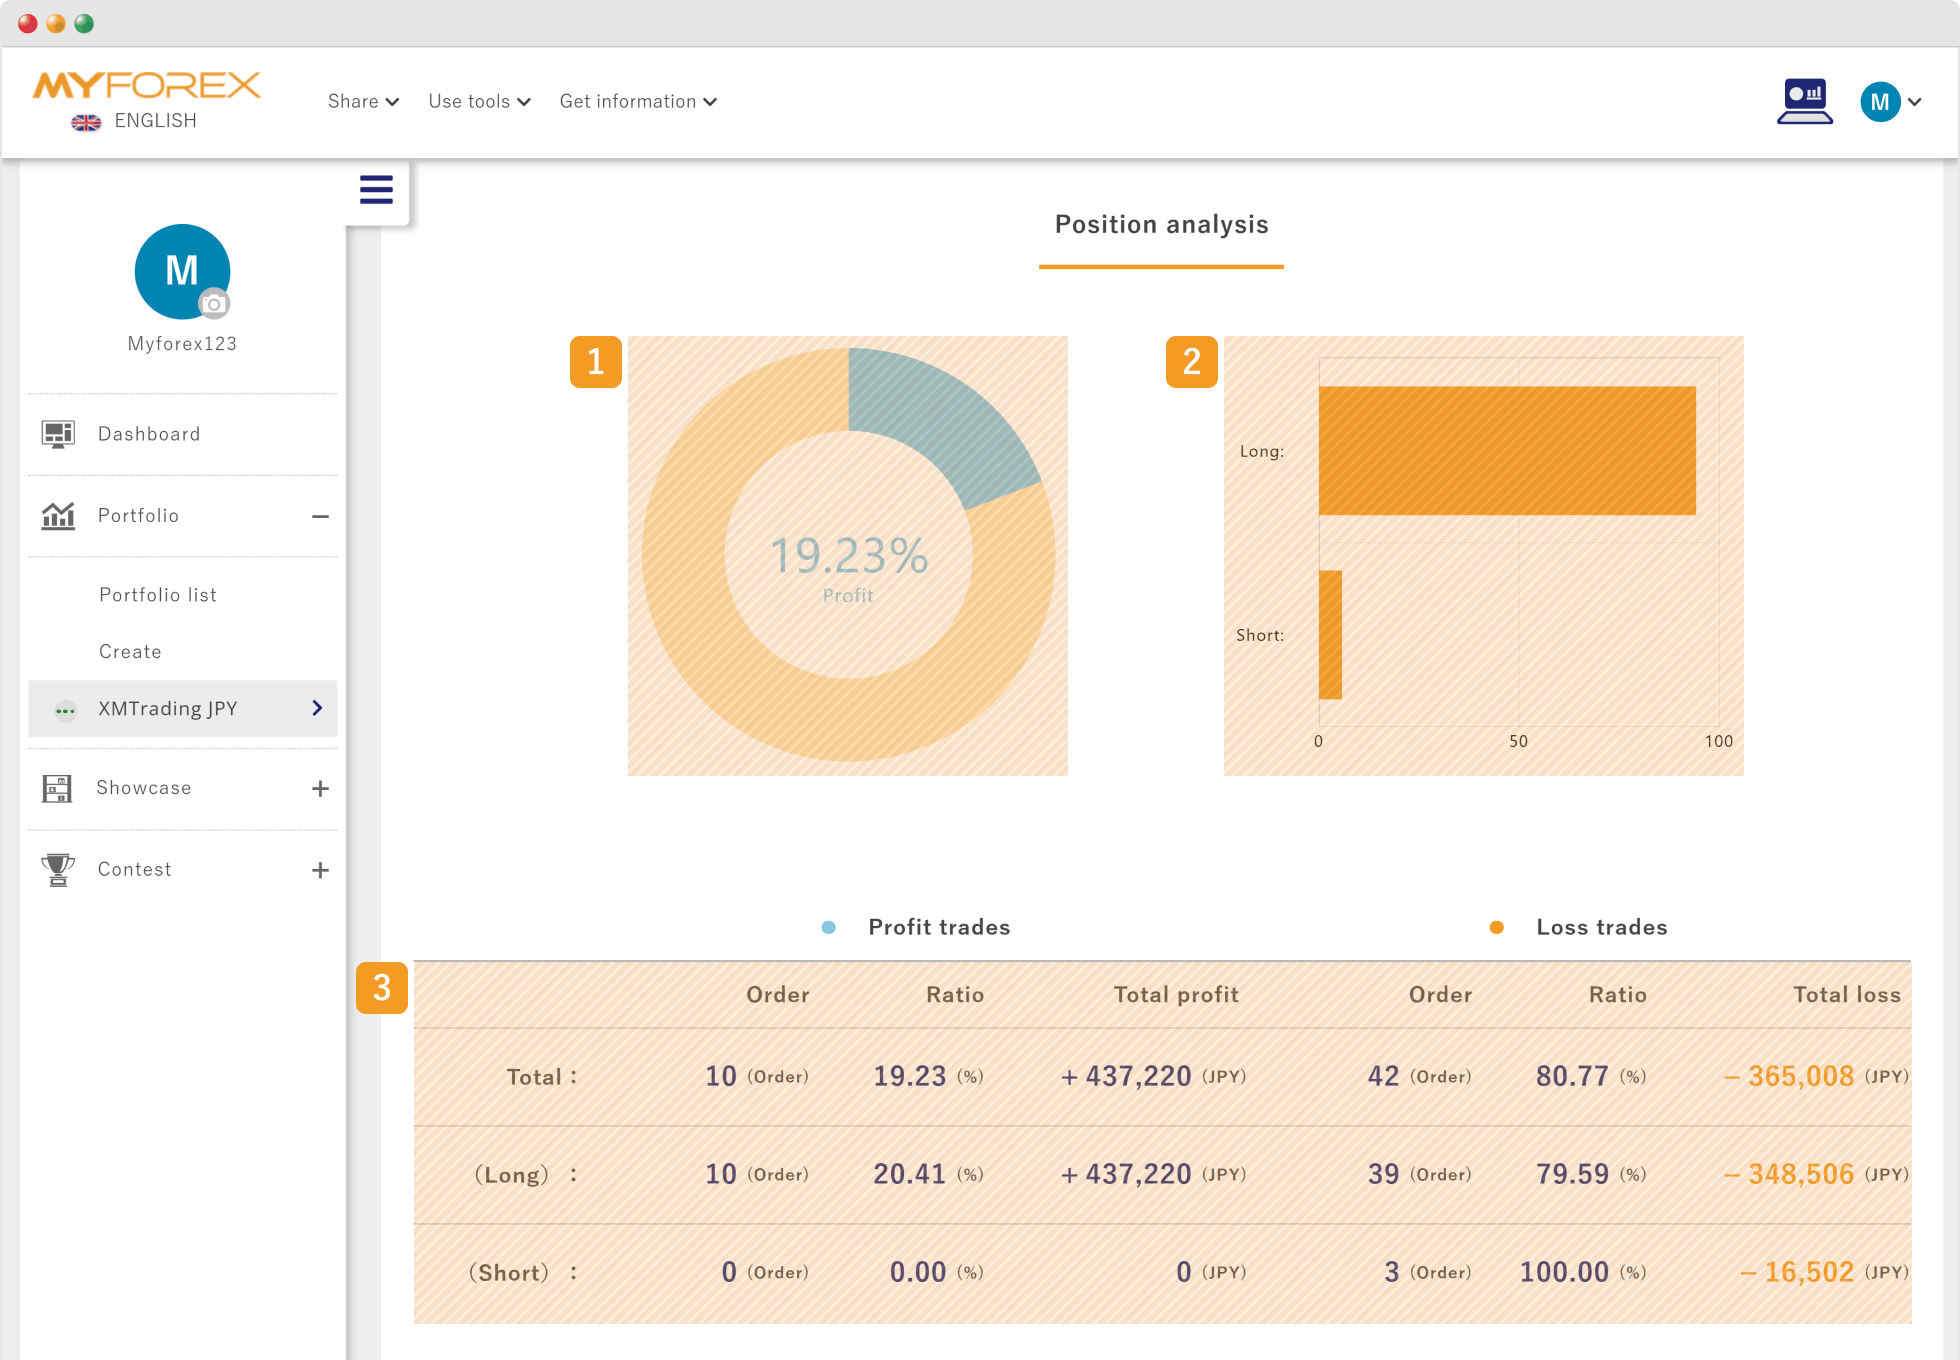
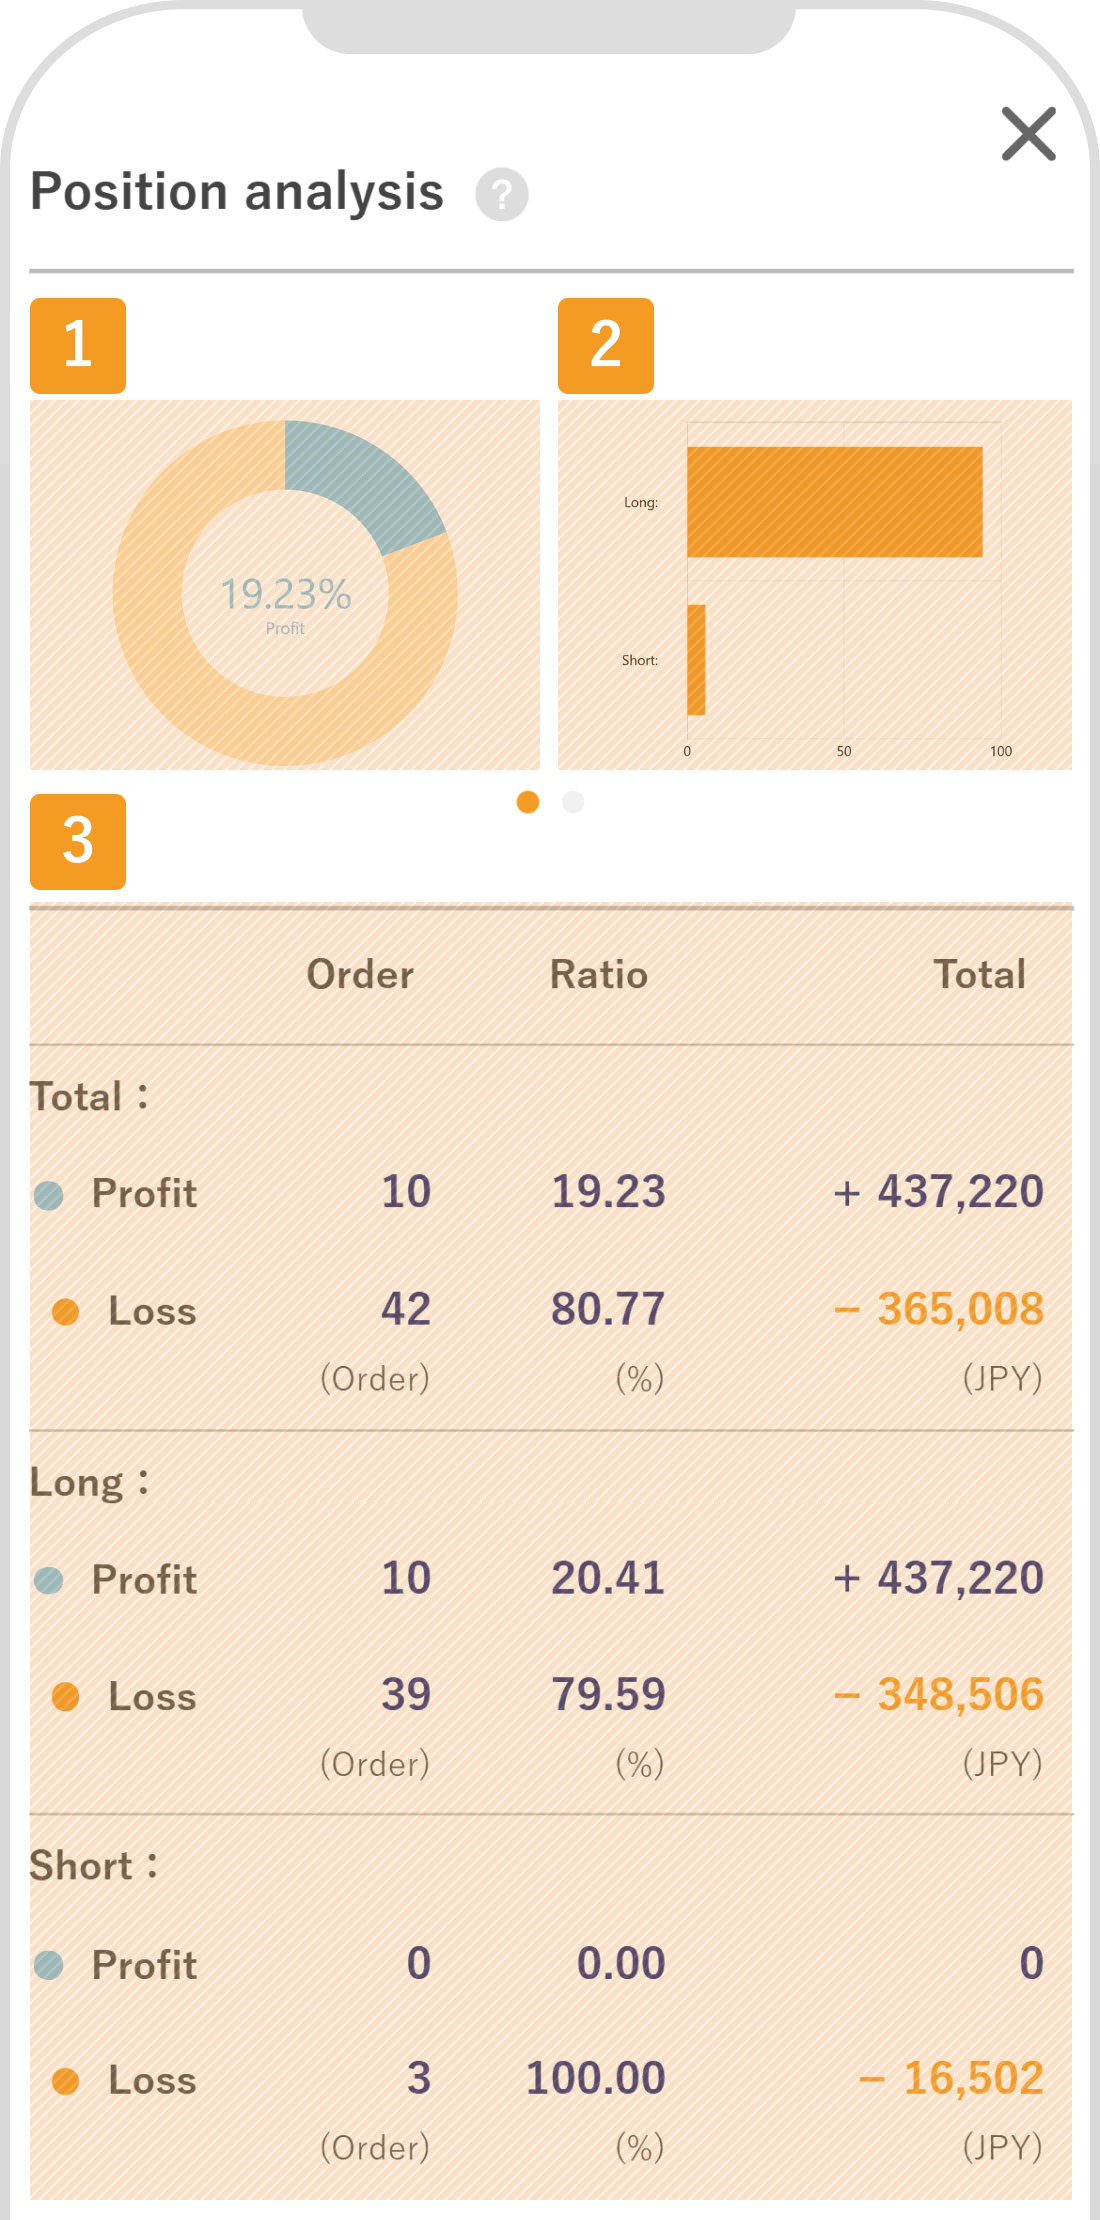
Please refer to the following section for what each represents.
Number | Item | Description |
|---|---|---|
1 | Profit/loss ratio | Represents the ratio of Profit trades to Loss trades in a pie chart. |
2 | Long/short ratio | Represents the ratio of Long (buy) trades to Short (sell) trades in a bar chart. |
3 | Profit/loss trades | Displays a list of the order count, ratio, and total profit/loss amount for each Profit trade and Loss trade. |
Symbol Analysis displays the trading lots, order count, ratio, and total profit/loss for each symbol you have traded so far. This allows you to track your win rate and profit/loss by symbol.
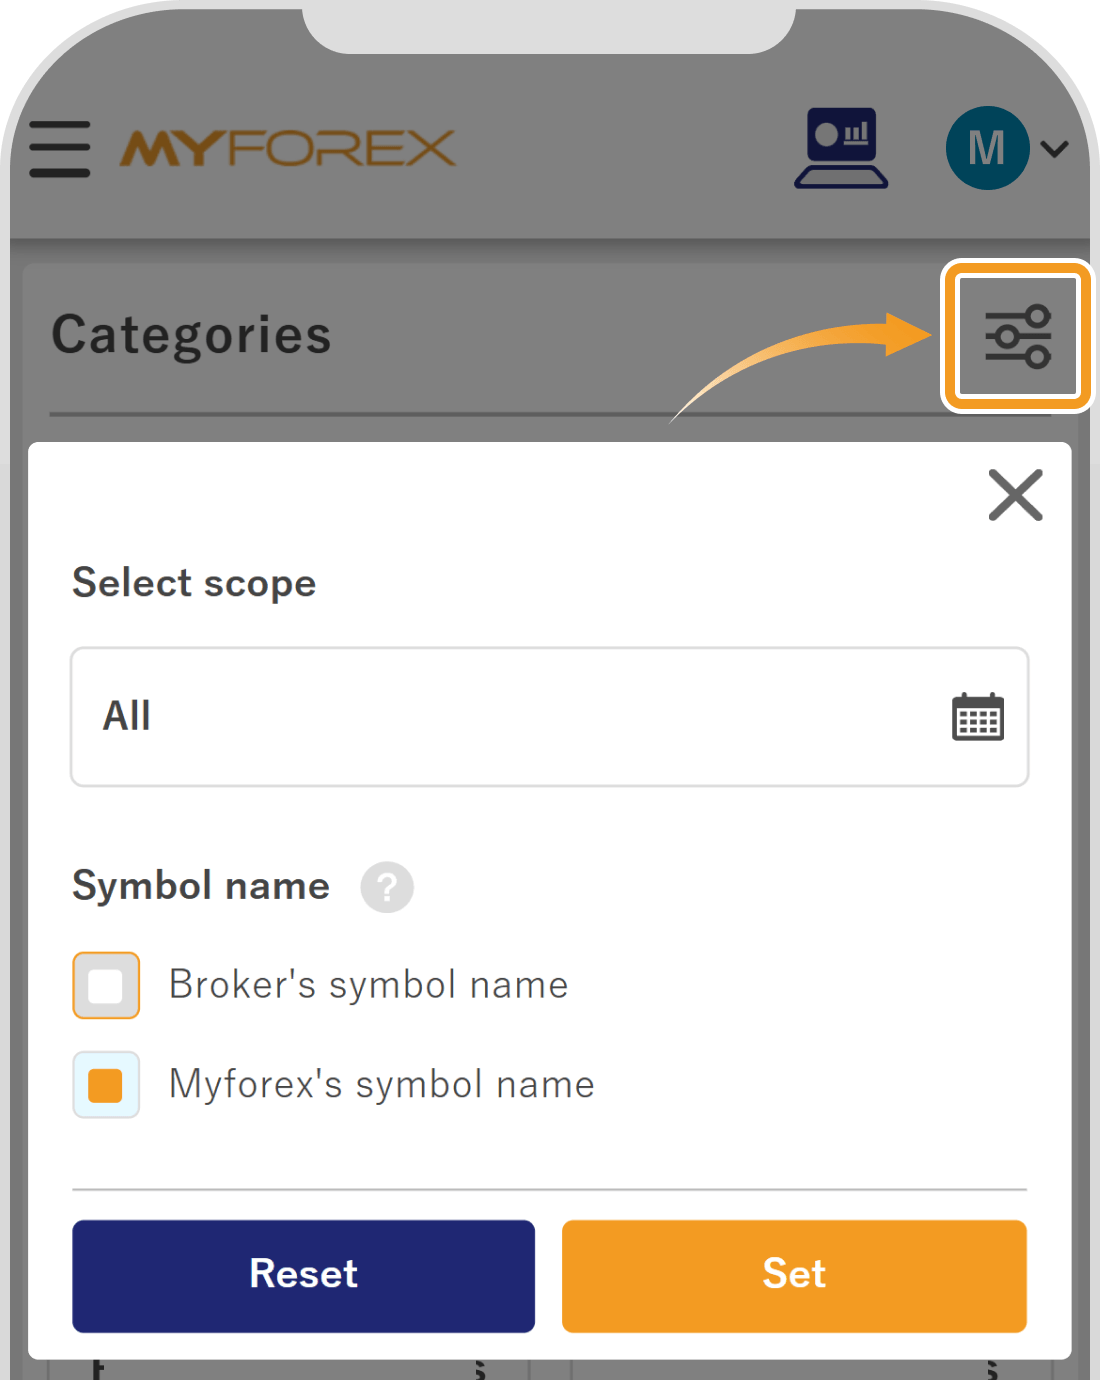
By default, symbols are displayed using Myforex common symbols, but you can switch to the broker’s symbol names from the symbol display settings.
Please refer to the section below for details on what can be confirmed in each.
By default, symbols are displayed using Myforex common symbols, but you can switch to the broker's symbol names from the setting button in the detailed information.
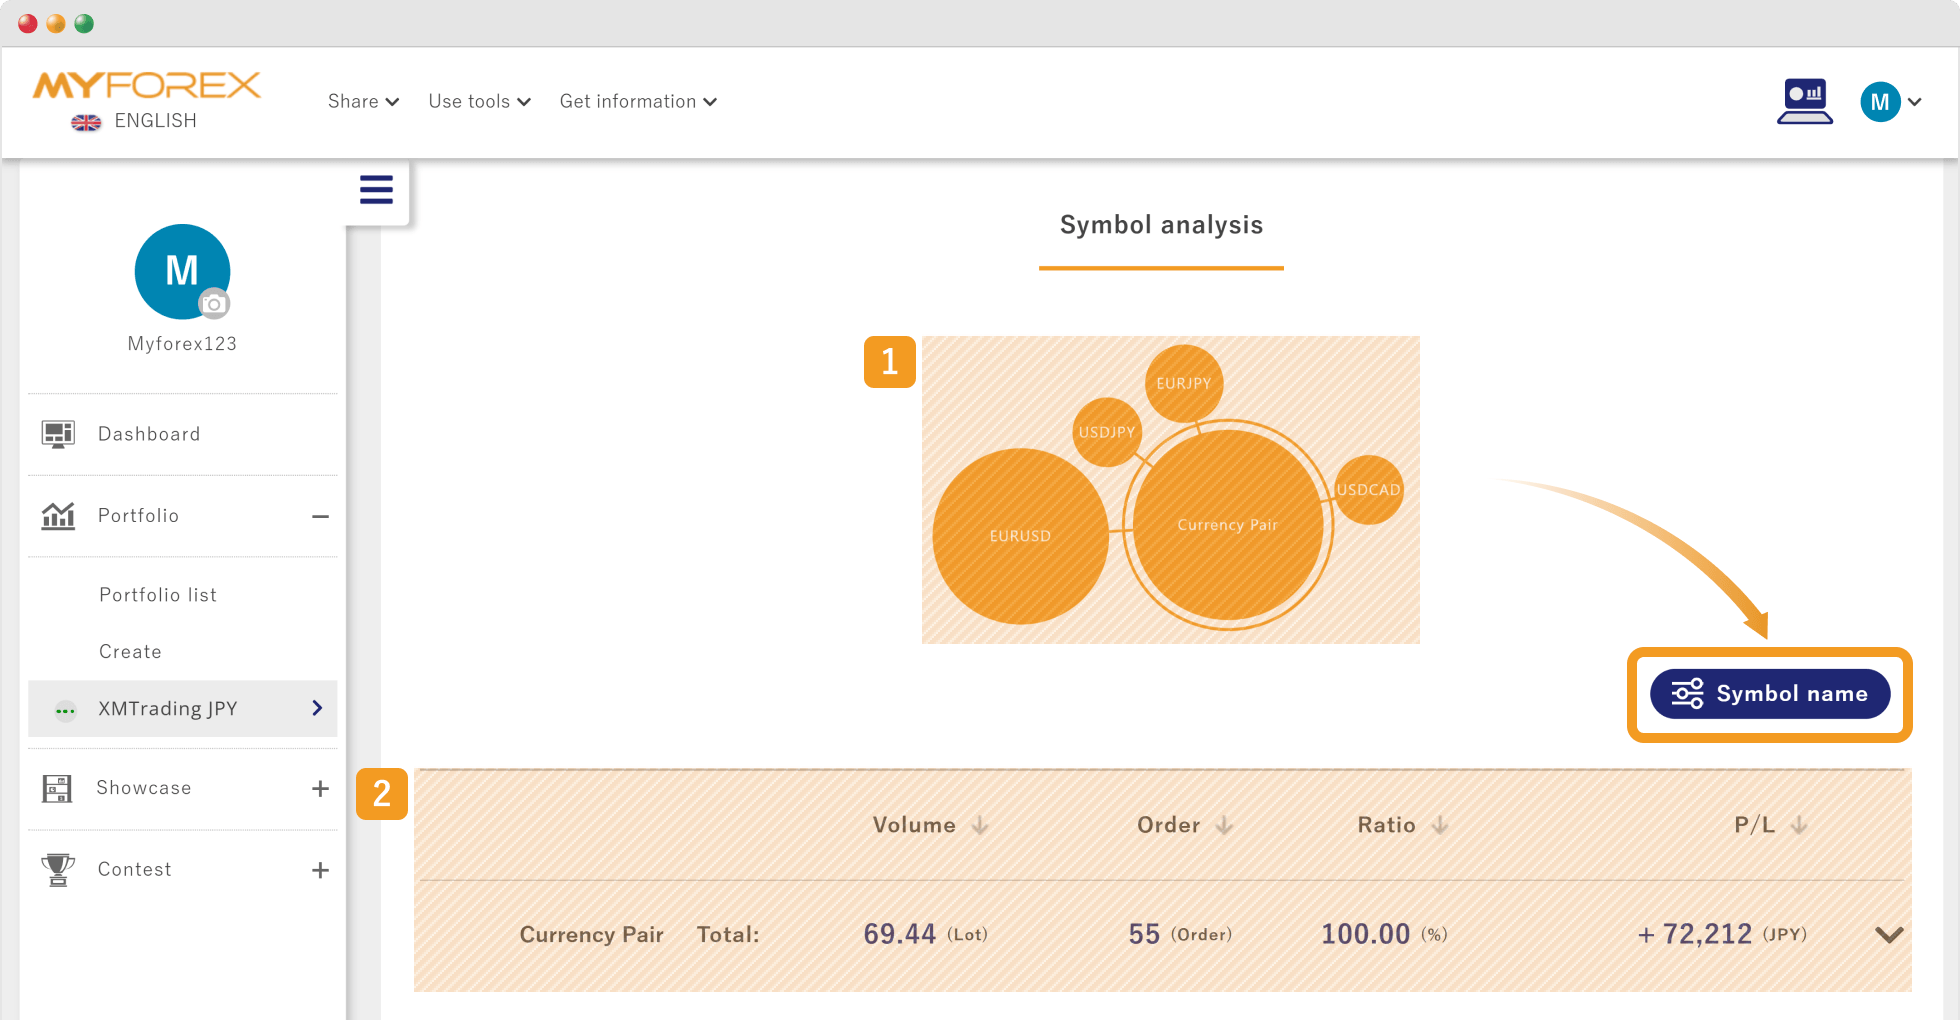
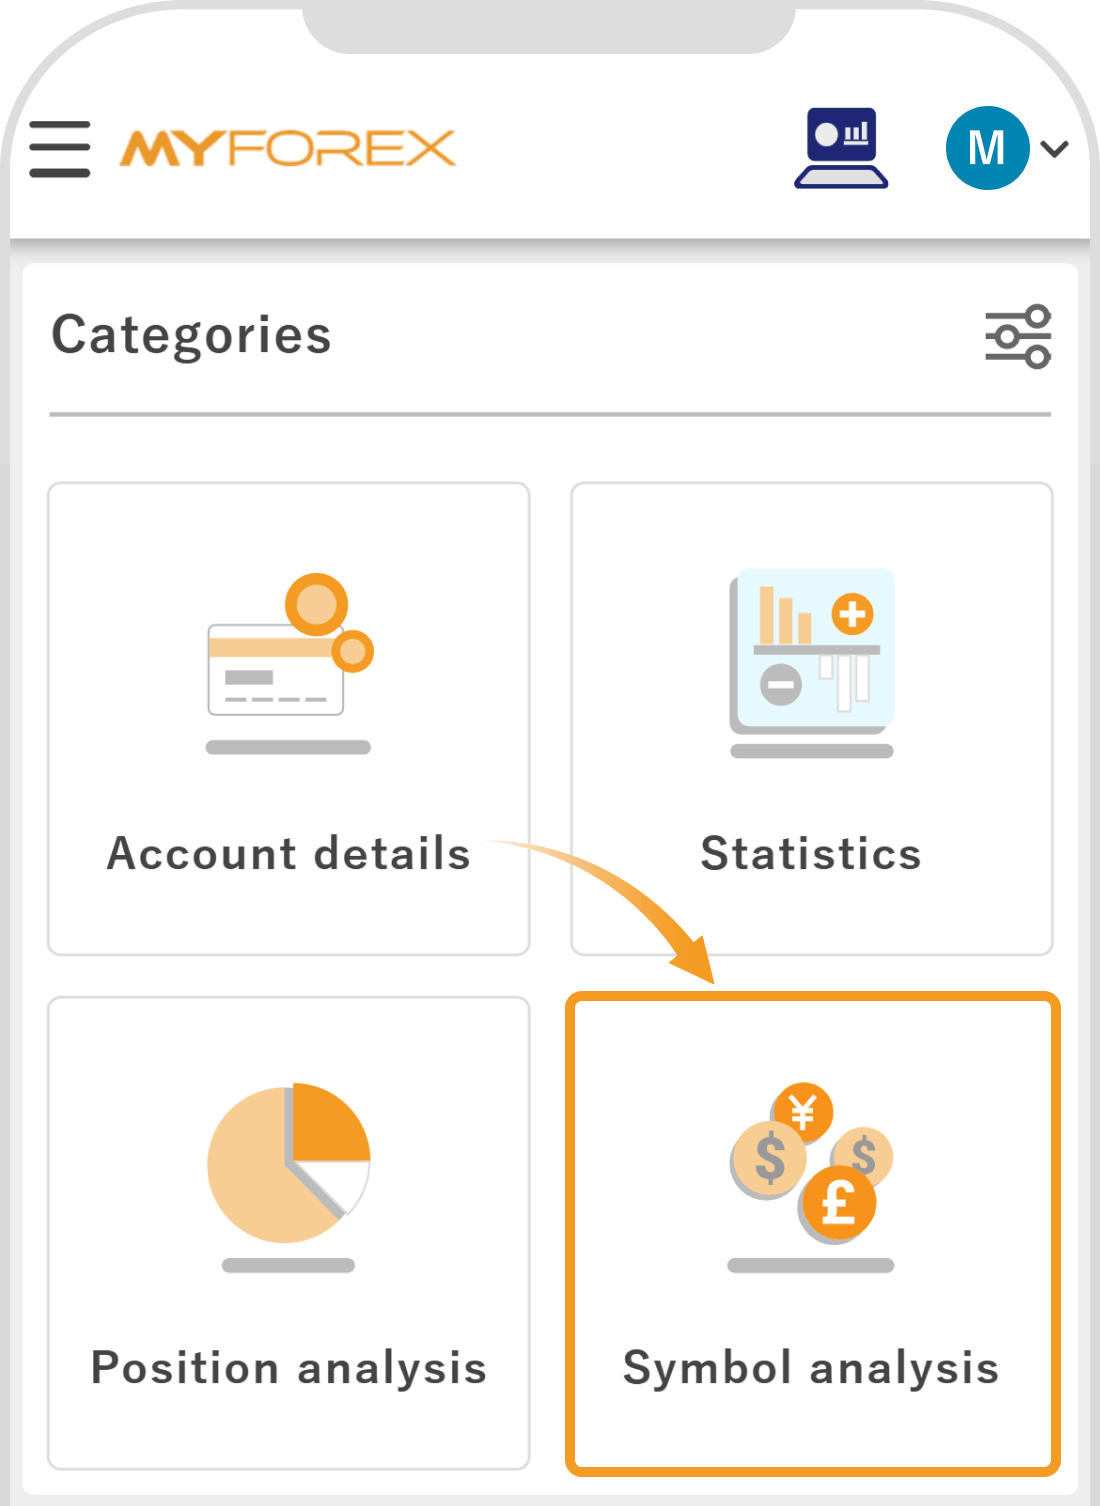
Please tap "Symbol analysis" in the Categories section.
Please refer to the section below for details on what can be confirmed in each.
Number | Item | Description |
|---|---|---|
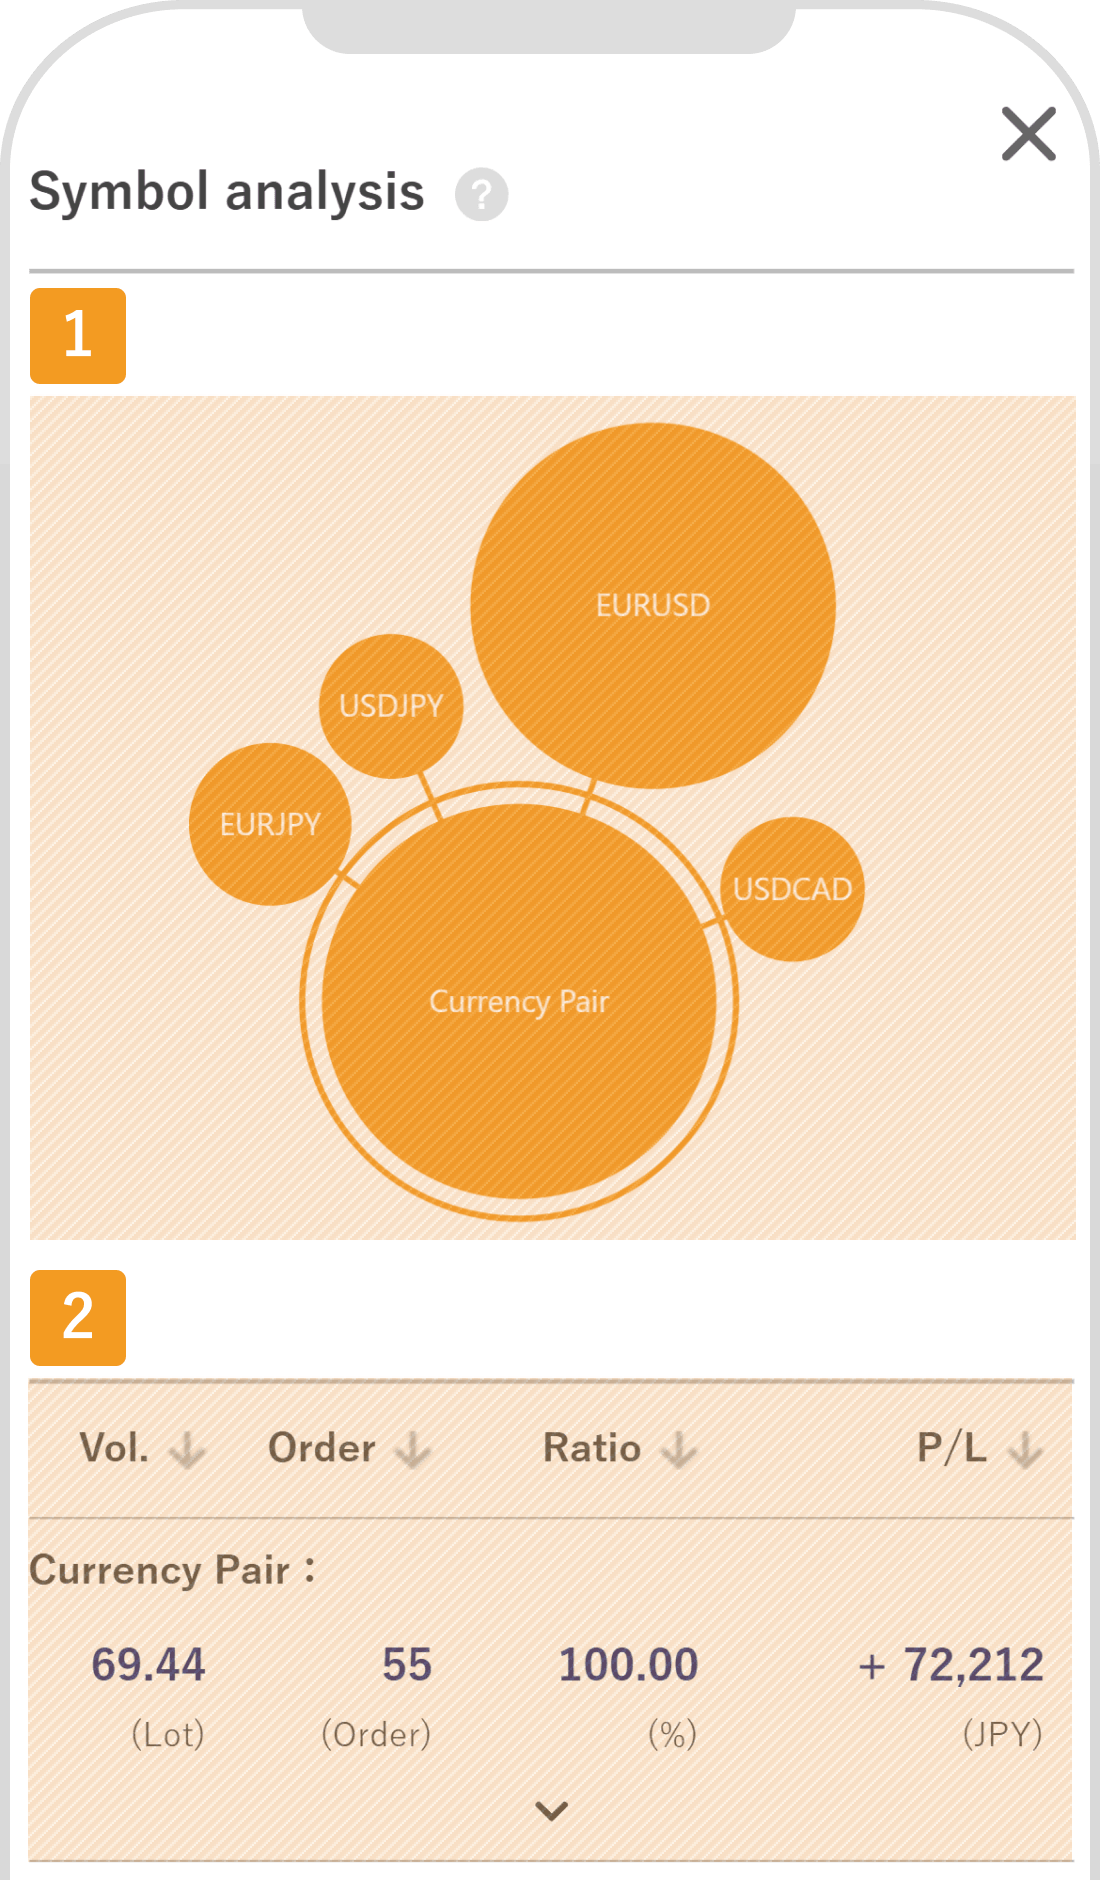
1 | Bubble chart by category | Represented in a bubble chart by category (Currency Pairs, Stock Indices/Spot, Crypto/Spot), where the size of the circle is proportional to the trading volume. Clicking each circle displays the symbols. |
2 | List by category | Displays volume (number of trading lots), order count, ratio, and total profit/loss by category (Currency Pairs, Stock Indices/Spot, Crypto/Spot). Click the "∨" on the right side to check the breakdown for each individual symbol. |
Number | Item | Description |
|---|---|---|
1 | Bubble chart by category | Represented in a bubble chart by category (Currency Pairs, Stock Indices/Spot, Crypto/Spot), where the size of the circle is proportional to the trading volume. Clicking each circle displays the symbols. |
2 | List by category | Displays volume (number of trading lots), order count, ratio, and total profit/loss by category (Currency Pairs, Stock Indices/Spot, Crypto/Spot). Click the "∨" on the right side to check the breakdown for each individual symbol. |
 Notice
If Symbol Analysis is not displayed, you may have selected the incorrect account type during portfolio setup. If the correct account type is not selected, the symbol names will not match those on your registered broker's side, and data will not be displayed correctly on the Performance screen.
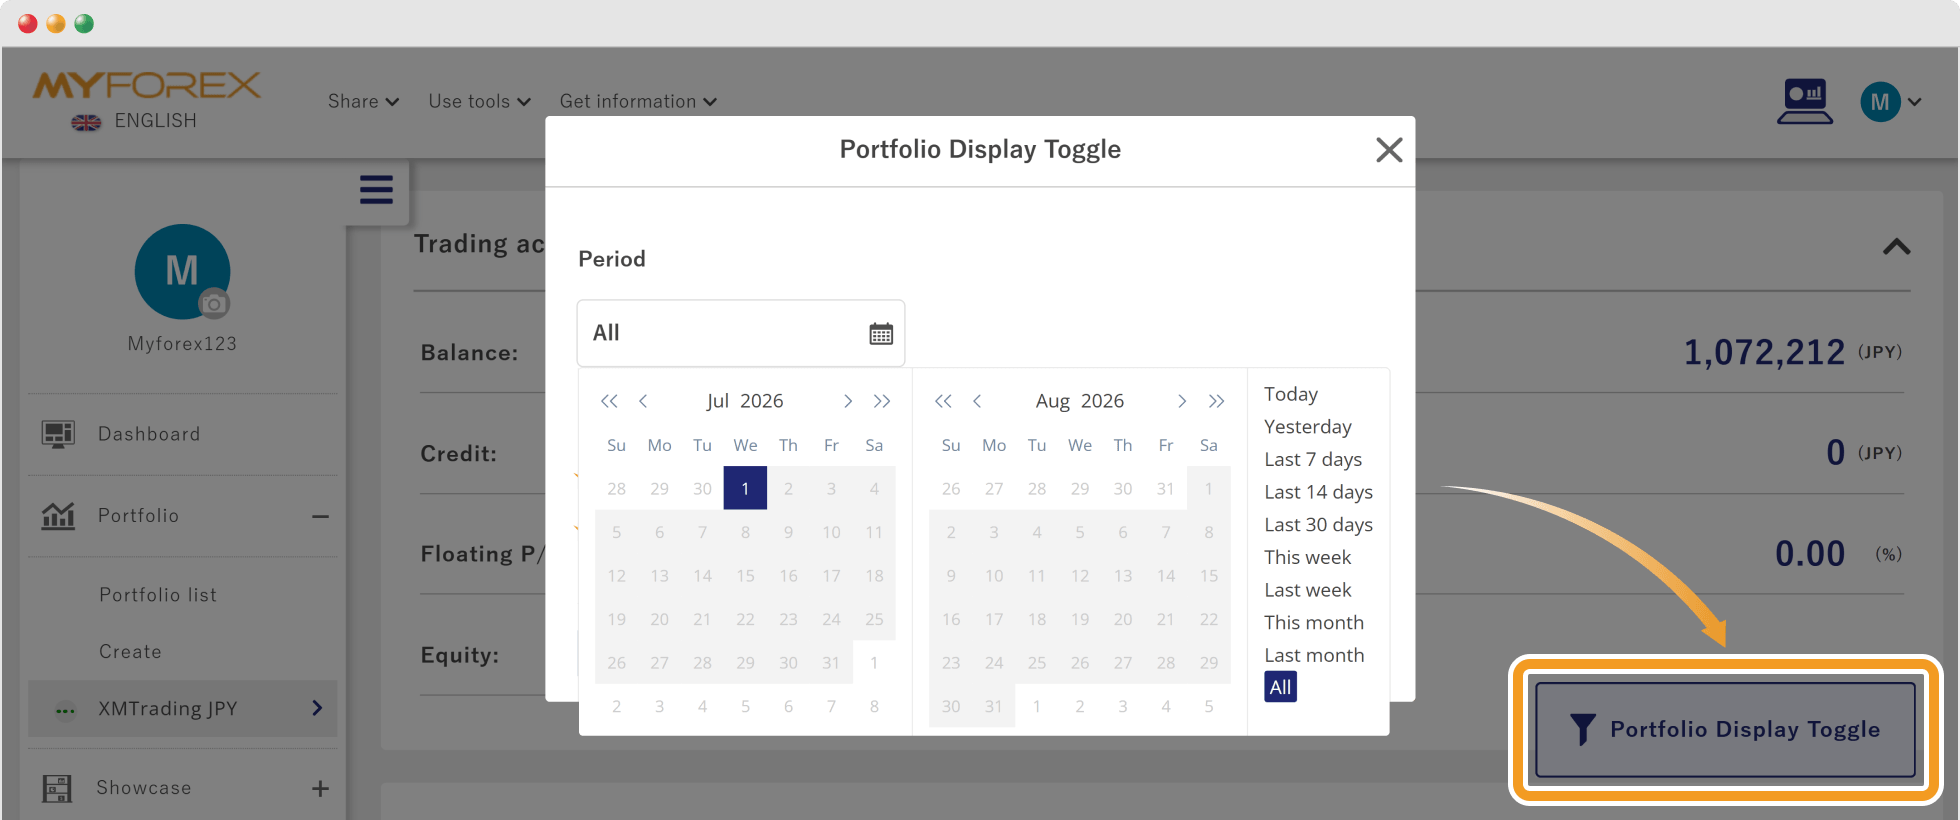
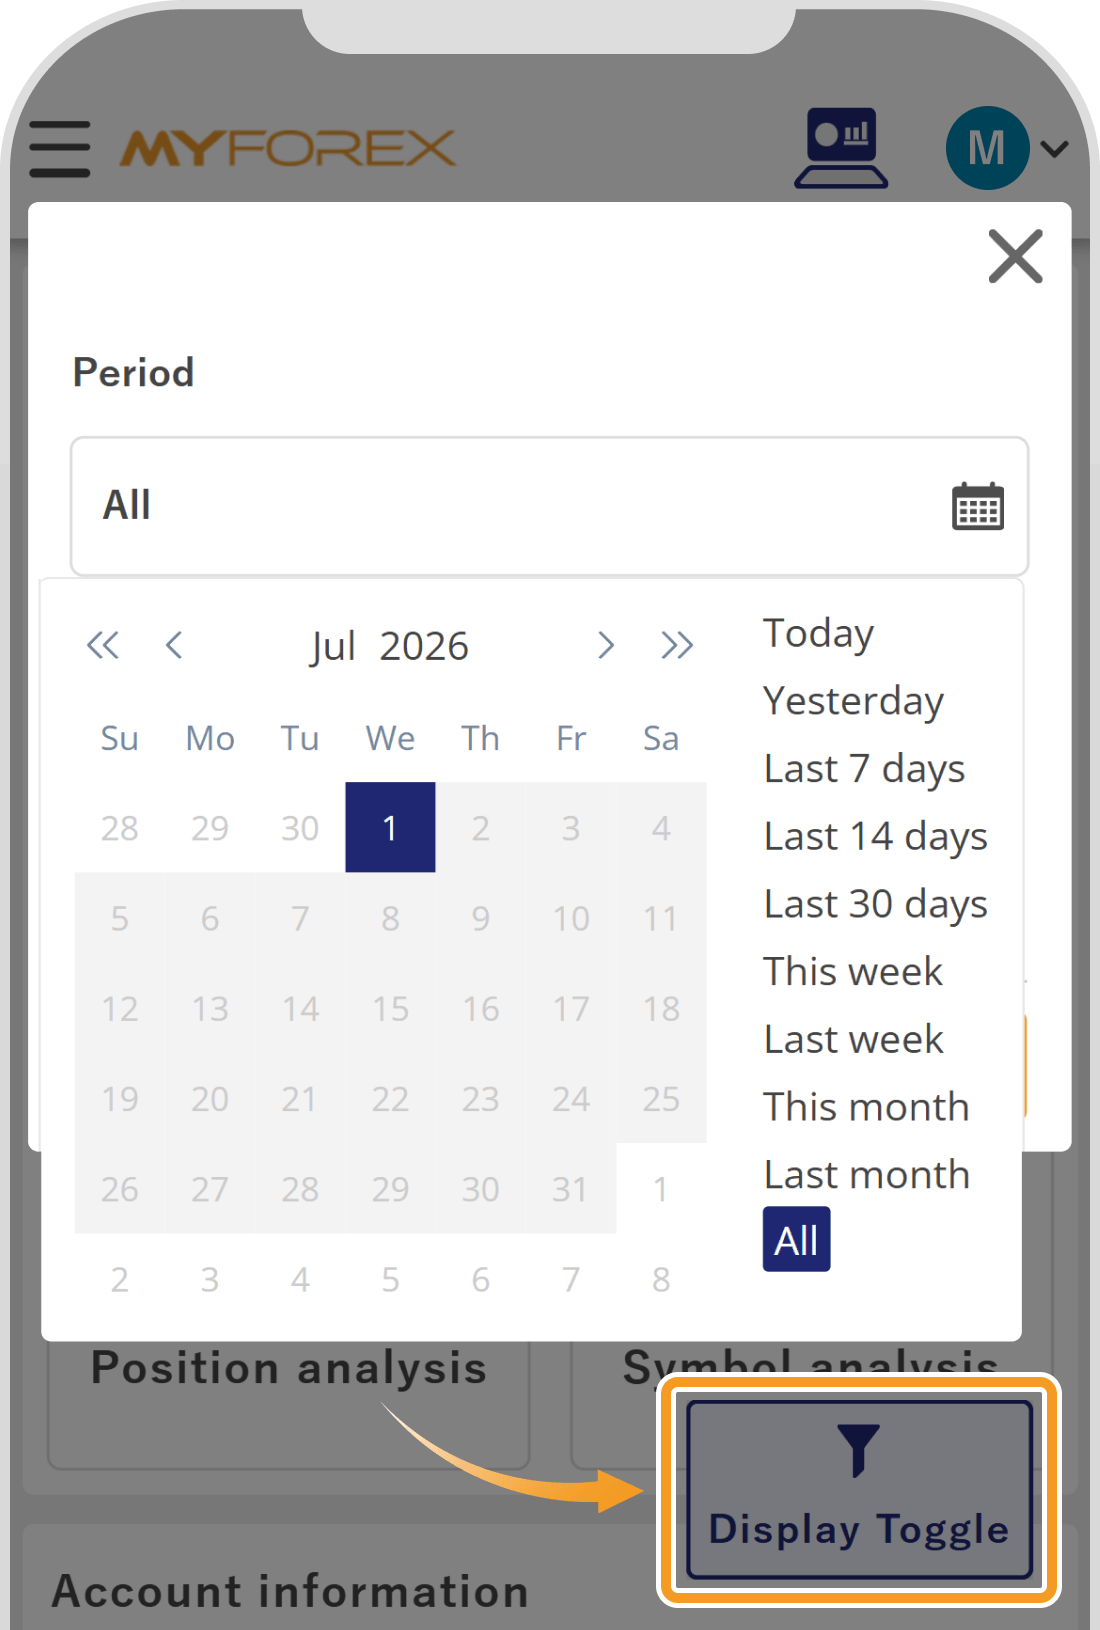
You can easily change the aggregation period reflected in the "Overall Performance" graph, "By Magic Number" graph, and "Statistics."
From the "Portfolio Display Toggle" button at the bottom right of the screen, select your desired period or select dates directly from the calendar.

Created
:2026.07.14

Last updated
:2026.07.17
That’s Great!
Thank you for your feedback
Sorry! We couldn't be helpful
Thank you for your feedback
Feedback sent
We appreciate your effort and will try to fix the article
We hope you find this article useful. Any comments or suggestions will be greatly appreciated.
We are also looking for writers with extensive experience in forex and crypto to join us.
Please contact us at support@myforex.com

Disclaimer:
All information and content provided on this website is provided for informational purposes only and is not intended to solicit any investment. Although all efforts are made in order to ensure that the information is correct, no guarantee is provided for the accuracy of any content on this website. Any decision made shall be the responsibility of the investor and Myforex does not take any responsibility whatsoever regarding the use of any information provided herein.
The copyright in our content belongs to us.
We welcome your use of our content within appropriate limits, including use through our sharing features, sharing on social media, and quotation. However, please refrain from unauthorized reuse, including but not limited to commercial use, reproduction with modification of content, or reproduction on websites that compete with us. We may take necessary measures, including but not limited to deletion of the relevant content, if we consider that the content has been used in an inappropriate or unauthorized manner.